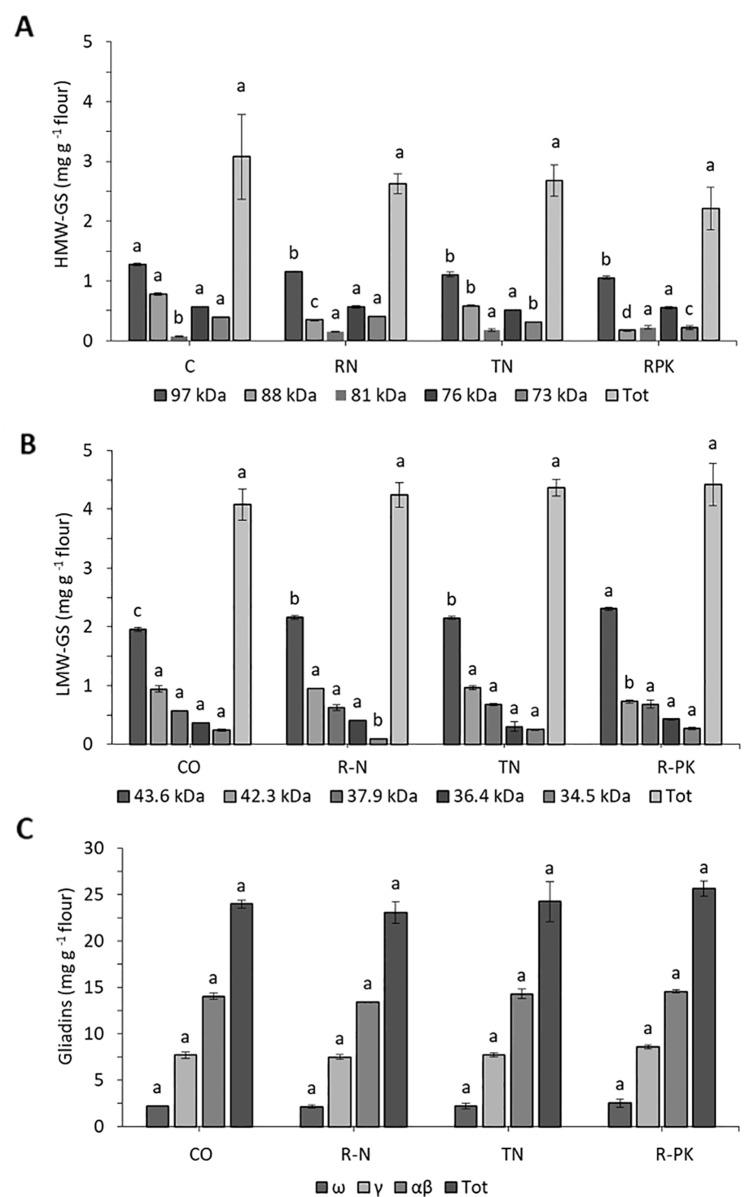
Figure 4.
High-molecular-weight glutenin (HMW-GS, A), low-molecular-weight glutenin subunits (LMW-GS, B), and gliadins (C) (mg g-1 D. W. flour; n = 3; mean ± s.e.) as represented by different kDa bands revealed with SDS-PAGE in Triticum aestivum plants inoculated with biofertilizers (TN, TripleN; R-N, Rhizosum N; R-PK, Rhizosum PK) vs noninoculated controls (CO). Letters indicate significant differences among treatments within the same band (Newman-Keuls test, P ≤ 0.05).

