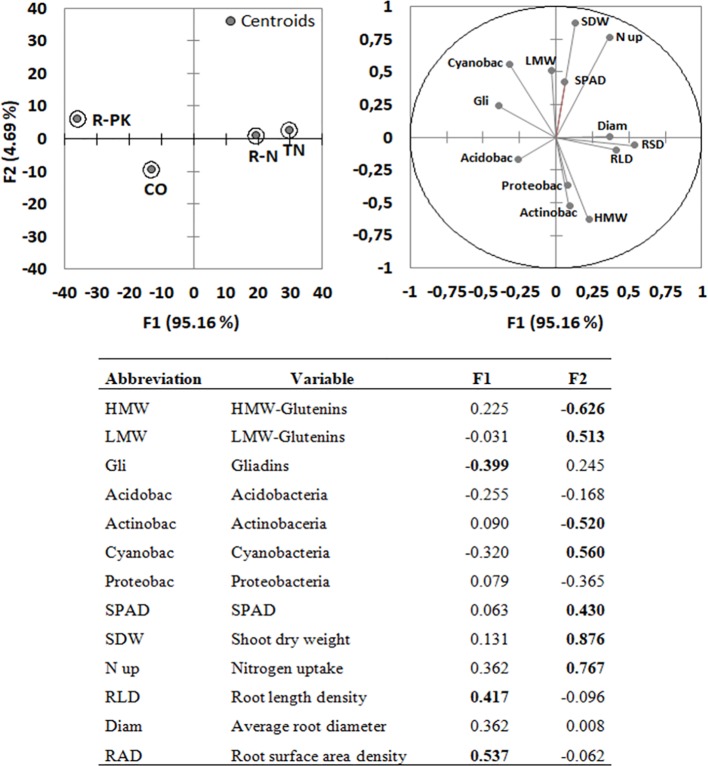
Figure 5.
Principal component analysis (PCA; top right) with variable loadings (values > |0.4| in bold; bottom) and discriminant analysis (DA; top left) for Triticum aestivum inoculated with biofertilizers (TN, TripleN; R-N, Rhizosum N; R-PK, Rhizosum PK) vs noninoculated controls (CO). Circles in the PCA include 75% of cases.

