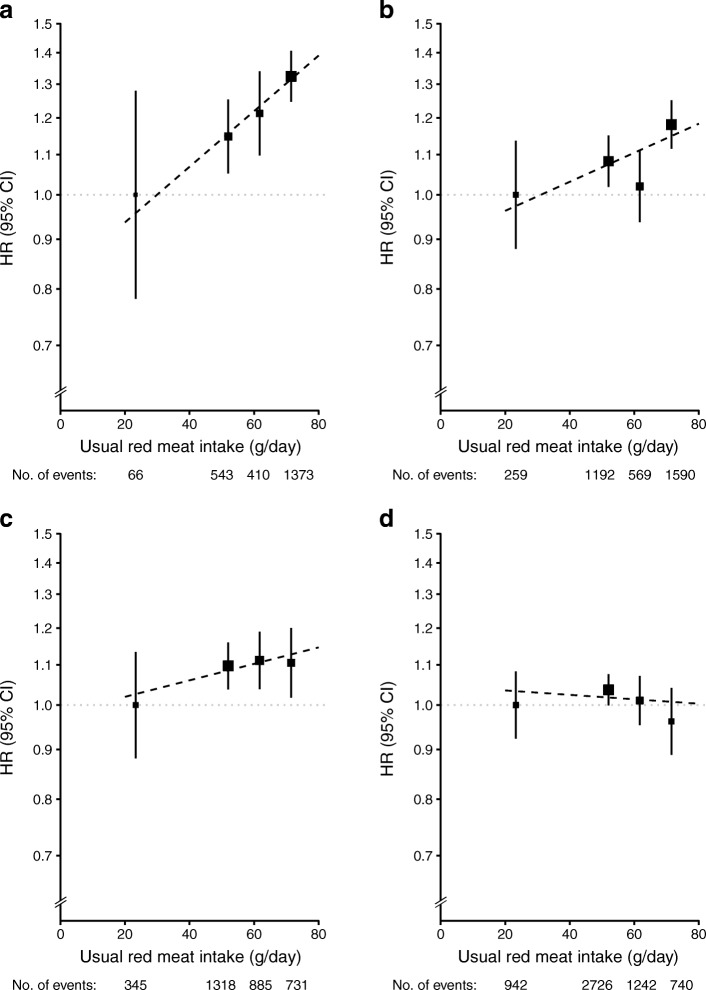
Fig. 3.
Adjusted HRs (95% CIs) for diabetes associated with red meat intake, by sex and area. (a) Urban men. (b) Urban women. (c) Rural men. (d) Rural women. Analyses were stratified by age-at-risk and region and adjusted for education, income, smoking, alcohol intake, physical activity, consumption of fresh fruit, fish and poultry, family history of diabetes, and BMI. The y axis was plotted on a loge scale with the lowest consumption group as reference category. Black squares, HRs (size is inversely proportional to the variance of the loge HR); vertical lines, 95% CIs; dashed diagonal lines, linear associations between red meat consumption diabetes risk

