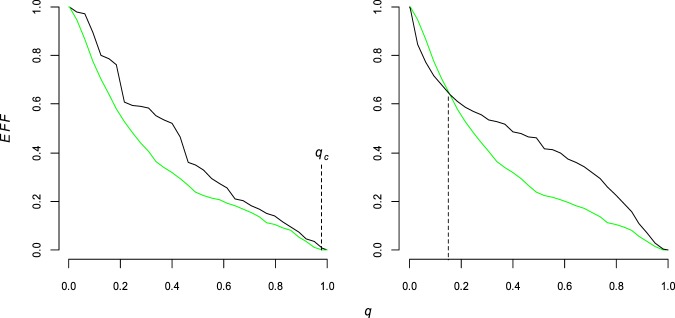
Figure 2.
The network functioning along the link removal process. Functioning efficiency measure (Eff) as a function of the fraction of link removed (q) for different attack strategies. The examples give in this chart are from the UK faculty network. Left chart: Strong strategy (green line) triggers a faster efficiency (Eff) decrease than the DP strategy (black line) and the robustness area (R) below the green curve is lower than the one below the black curve. The widely used percolation threshold qc is roughly the same for the two strategies (q = 0.98, vertical dashed) and this measure of the network functioning is not able to individuate the difference. Right chart: in this simulation for q = 0.16 (abscissa of the vertical dashed line) we observe a cross between Strong (green) and the BC (black) strategy curves; this means that the black strategy is more harmful at the beginning of the removal process (before q = 0.16) and the green strategy is more efficacy after q = 0.16. The robustness area resuming the entire process in a single value is not able to evaluate the local efficacy of the strategy; to understand the efficacy of the attack strategies in the first fraction of the removal process we add a comparison for three small values of q = (0.05, 0.1, 0.15).

