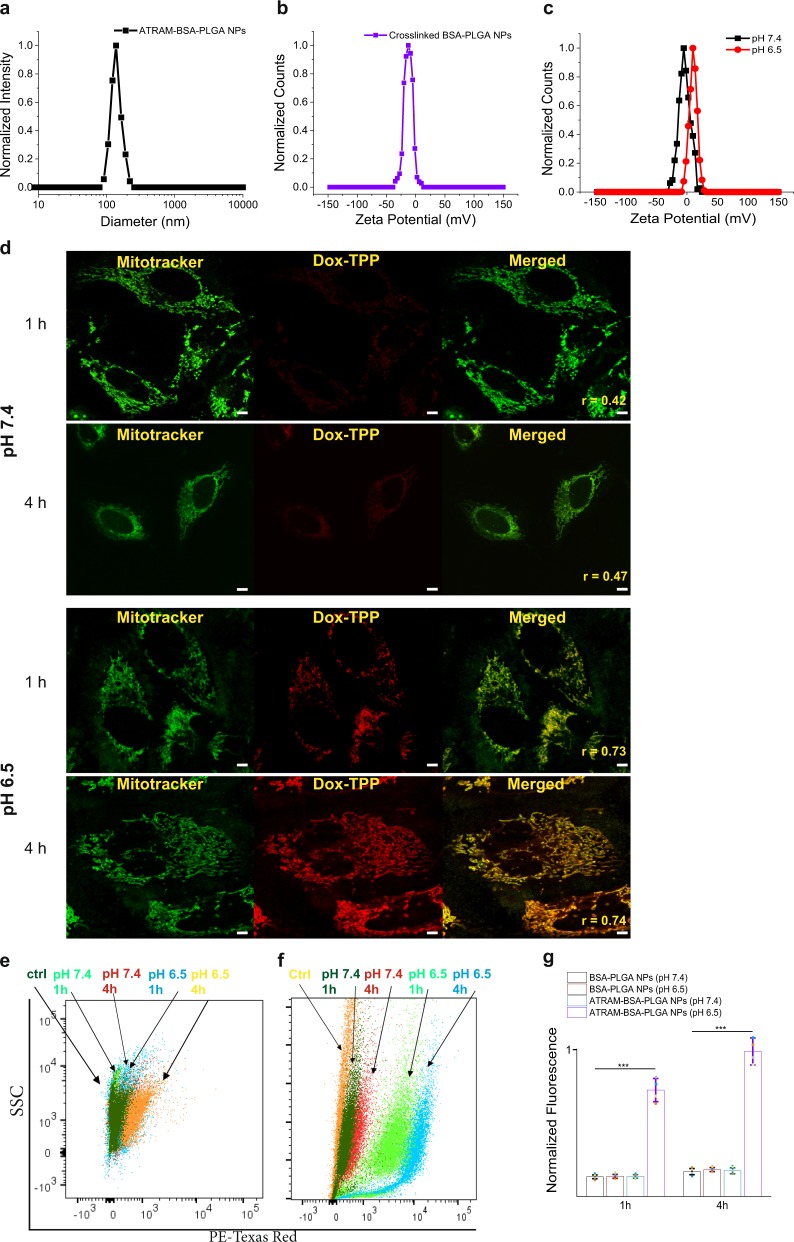
Fig. 4. Cellular uptake of ATRAM-BSA-PLGA NPs is strongly pH-dependent.
a Size analysis for ATRAM-BSA-PLGA NPs in aqueous solution. b, c Zeta potential measurements of BSA-PLGA (b) and ATRAM-BSA-PLGA (c) NPs in aqueous solution. d Confocal laser scanning microscopy images of MCF-7 cells incubated for 1 or 4 h with Dox-TPP loaded ATRAM-BSA-PLGA NPs at physiological or acidic pH. Quantification of colocalization of the Dox-TPP cargo with mitochondria using Pearson’s correlation coefficient (r). Scale bar = 10 µm. e–g Flow cytometry analysis of cellular uptake of Dox-TPP loaded BSA-PLGA and ATRAM-BSA-PLGA NPs in MCF-7 cells: plot of side scatter (SSC) vs fluorescence signal for MCF-7 cells that were either untreated (ctrl), or treated with Dox-TPP loaded BSA-PLGA (e) or ATRAM-BSA-PLGA (f) NPs for 1 or 4 h at pH 7.4 or 6.5; g quantification of cellular uptake of BSA-PLGA and ATRAM-BSA-PLGA NPs at different incubation times and pHs from the flow cytometry analysis (n = 4). ***P < 0.001 compared with NPs at pH 7.4.

