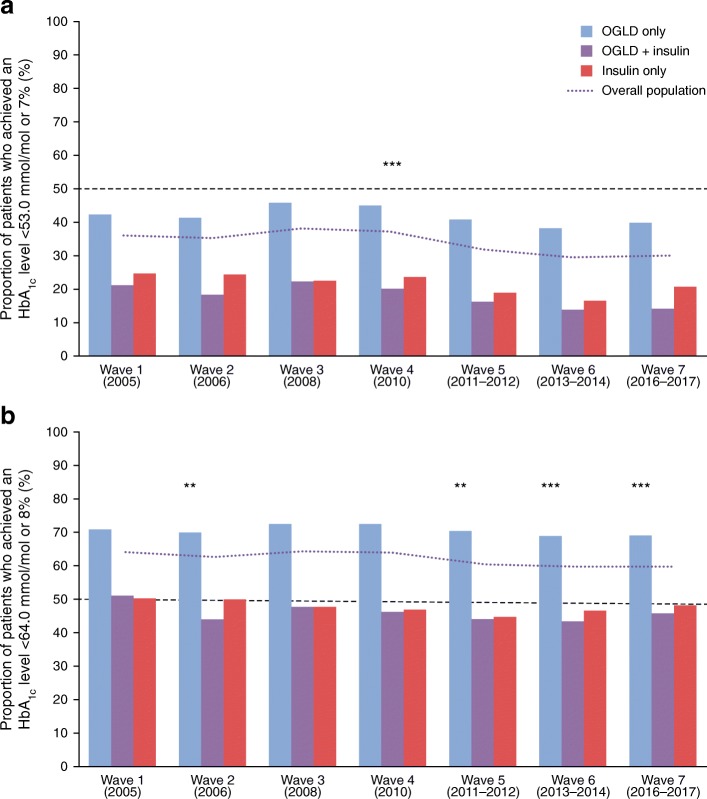
Fig. 1.
The proportion of participants attaining HbA1c goal defined as: (a) <53 mmol/mol or <7%; and (b) <64 mmol/mol or <8%, between 2005 and 2017. The p values show test of significance for trend in HbA1c goal achievement in the overall population: (a) over all waves; or (b) waves 2–7 vs reference wave 1. **p < 0.01, ***p < 0.001. A two-sided Cochran–Armitage test was used to investigate the relationship between study waves and the variables of interest, assuming a no-trend null hypothesis: (a) p < 0.0001 for trend over all waves; (b) p = 0.0036 for wave 2 vs wave 1, p = 0.2991 for wave 3 vs wave 1, p = 0.0514 for wave 4 vs wave 1, p = 0.0011 for wave 5 vs wave 1, p = 0.0006 for wave 6 vs wave 1 and p = 0.0017 for wave 7 vs wave 1. HbA1c goal achievement data were missing for 3893 participants in wave 1, 5084 participants in wave 2, 3150 participants in wave 3, 961 participants in wave 4, 1256 participants in wave 5, 548 participants in wave 6 and 608 participants in wave 7

