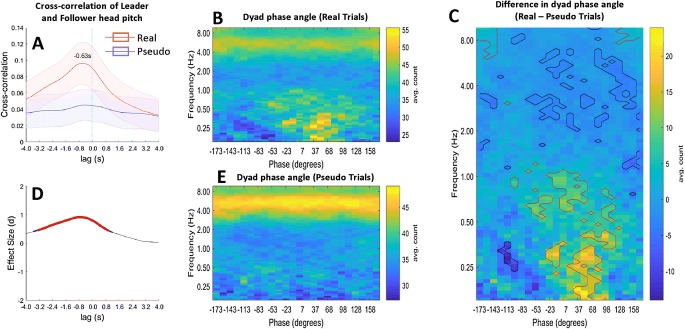
Fig. 4.
Phase angle analysis. a Average cross-correlation of head pitch between Leader and Follower participants across a whole trial, for time delays of − 4–4 s. There is a peak at − 0.63 s, indicating that Followers match Leaders with around a 600 ms time delay. d The Cohen’s-d effect size for the difference in cross-correlation between real and pseudo trials, for time delays of − 4–4 s. Red dots indicate significant t-tests that pass a p < .05 FDR significance threshold. b (real trials) and e (pseudo trials) show the average phase angle within a dyad for all time points across the trial (y-axis) and all motion frequencies (x-axis). Panel C shows the difference between phase angles in real trials (b) and pseudo trials (e). Regions outlined in red show the phase angles and frequencies where there was significantly greater coherence in real than pseudo trials (a positive effect), indicating that the Follower lags the Leader by around 30–90° of phase. Regions outlined in blue show where there was a significant negative effect (Color figure online)

