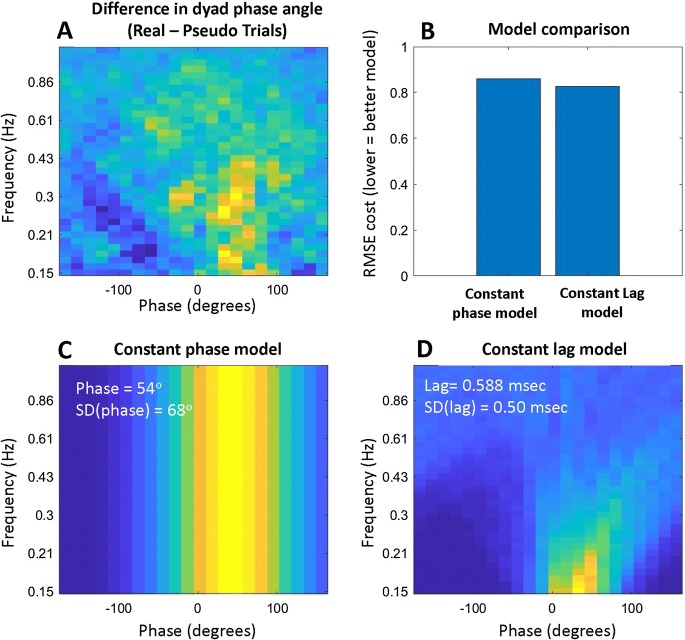
Fig. 5.
Modeling the phase-frequency relationship. a The same data as the lower part of Fig. 4c, i.e. the difference in dyads’ average phase relationship between real and pseudo trials. This data was modeled to compare a ‘constant-phase’ model (c) with a ‘constant-lag’ model (d). Each model was optimized to fit the data and the optimal parameters are given in white text. The constant-lag model gave a better overall fit to the data in terms of the root-mean-squared-error (RMSE) (b)

