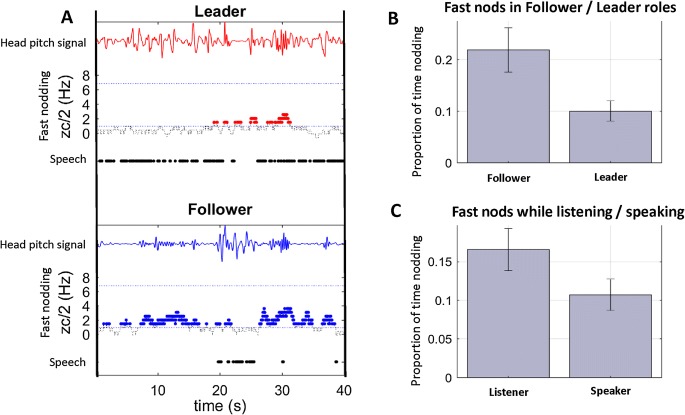
Fig. 6.
Detection of fast nods and their relationship to speech. a A sample timeline from a Leader and Follower in the same trial, illustrating the head pitch signal (top of plot), the output of the fast-nod detection algorithm (zc/2, x-axis) and whether that person is speaking or not (bottom of plot). Fast nods (colored dots) are more common when a participant is listening. This is seen when comparing fast-nods categorized by the role of Leader versus Follower over a whole trial (b) and also when comparing the rate of fast-nods when an individual is speaking or not-speaking (determined from audio data for each time point within a trial) in c

