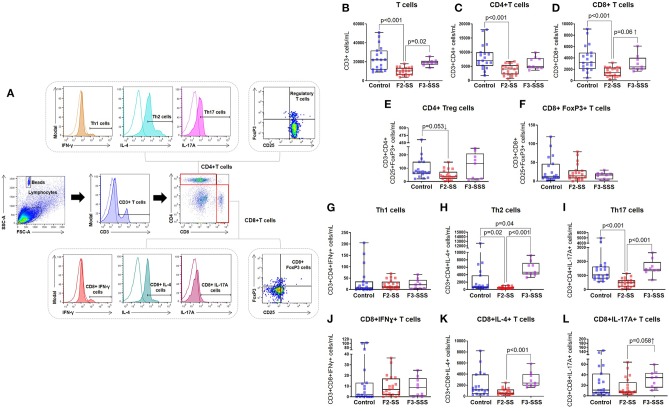
Figure 4.
Immunophenotyping of T cell subsets in prenatally stressed neonates. (A) Gating strategy used to identify T cell subsets. (B) Number of conventional T cells, (C) CD4+ T cells, (D) CD8+ T cells, (E) regulatory CD4+ T cells or CD4+ Tregs, (F) CD8+FoxP3+ T cells, (G) Th1 cells, (H) Th2 cells, (I) Th17 cells, (J) CD8+IFNγ+ T cells, (K) CD8+IL-4+ T cells, (L) CD8+IL-17A+ T cells (control n = 19; F2-SS n = 21; F3-SSS n = 9). Mid-lines indicate medians, boxes indicate interquartile ranges, and whiskers indicate min–max range.

