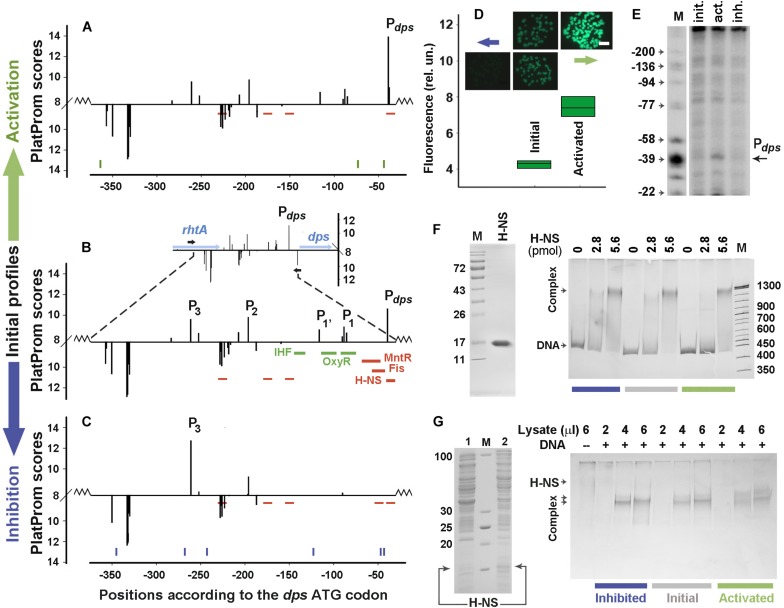
FIGURE 2.
Error-prone PCR mutagenesis of the dps promoter region. (A–C) The distribution of TSPs (bars) predicted by PlatProm in the wild-type (B) and mutated (A,C) sequences (p < 0.00004). The vertical bars above and below from the X-axes mark TSPs of promoters predicted on the top and bottom strands, respectively. Their amplitudes correspond to the PlatProm scores. An insert in (B) shows the profile obtained in the genomic environment, while the main panel demonstrates the scores calculated for the plasmid insert (bordered by zigzag lines). Horizontal blue and black arrows show the positioning of genes and primers used for cloning, respectively. Thick colored lines indicate known binding sites for IHF, OxyR, MntR, Fis, and H-NS. Thin red lines show predicted sites for H-NS. Ticks in (A,C) show the locations of point mutations generated by random mutagenesis. (D) Mutation-mediated changes in the gfp expression visualized by fluorescent microscopy (colonies) and measured in lysates using a fluorescent spectrophotometer (box plots). The exposition time for imaging was 190 ms. Box plots represent five independent experiments. (E) Primer extension assays carried out with the gfp-specific primer. The total RNA was purified from the cells transformed with the initial reporter vector and mutant derivatives obtained after negative and positive selection. DNA markers (M) indicate positions in respect to the dps ATG codon. (F) The purity of H-NS and EMSA of purified protein with 0.5 pmol of DNA fragments amplified from the initial or mutagenized fragments. (G) SDS-PAGE with lysates obtained from E. coli BL21(DE3)Δhns cells transformed with pGEM_H-NS-His before (line 1) or after (line 2) IPTG induction and EMSA carried out with the same DNA fragments as in (F). The amount of the pure H-NS (F) and the volume of lysate (G) used are indicated above the gels. Protein concentration in the lysate was 0.36 μg/μl.

