
Figure 1.
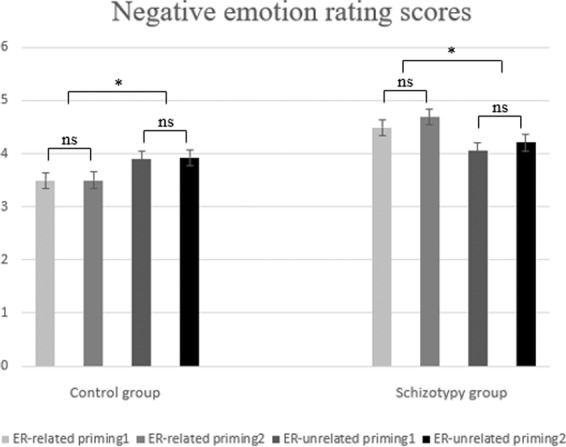
Bar plots for negative emotion rating scores. The larger rating scores indicated stronger negative emotion experience. “1” and “2” refer to order of rating. Error bars indicate the standard errors (* means p < 0.050).
Official websites use .gov
A
.gov website belongs to an official
government organization in the United States.
Secure .gov websites use HTTPS
A lock (
) or https:// means you've safely
connected to the .gov website. Share sensitive
information only on official, secure websites.
Bar plots for negative emotion rating scores. The larger rating scores indicated stronger negative emotion experience. “1” and “2” refer to order of rating. Error bars indicate the standard errors (* means p < 0.050).