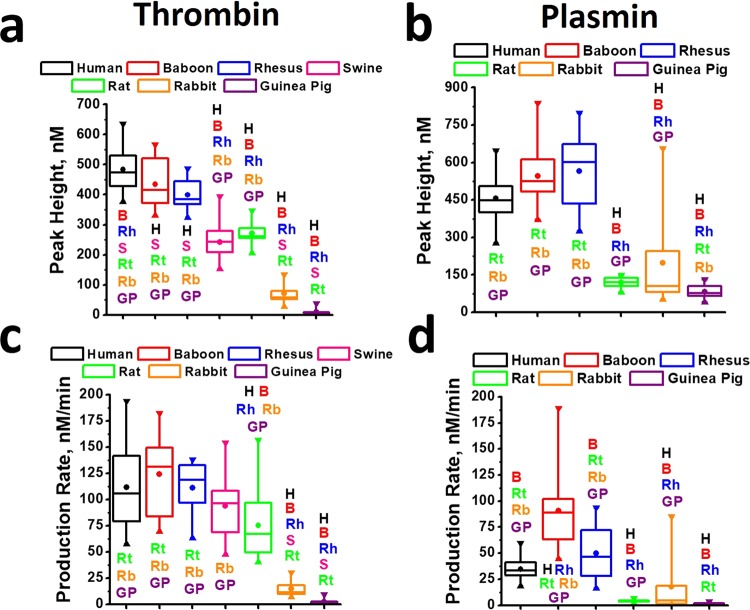
Figure 4.
(a,b) Thrombin (a) and plasmin (b) PH values obtained in PPPs from PPPs from different animals. (c,d) Thrombin (c) and plasmin (d) PR values obtained in PPPs from PPPs from different animals. Upper horizontal line of each box indicates the 75th percentile, and the lower horizontal line of box – indicates the 25th percentile, horizontal line inside box – median, circle inside box – mean value, ▼ – maximal value, ▲ – minimal value. H, B, Rh, S, Rt, Rb and G indicate significant difference from human samples (H), baboon samples (B), rhesus samples (Rh) swine samples (S), rat samples (Rt), rabbit samples (Rb) and Guinea pig samples (G). Statistics was obtained by Kruskal-Wallis test. Significance was set at a p-value less than 0.05.

