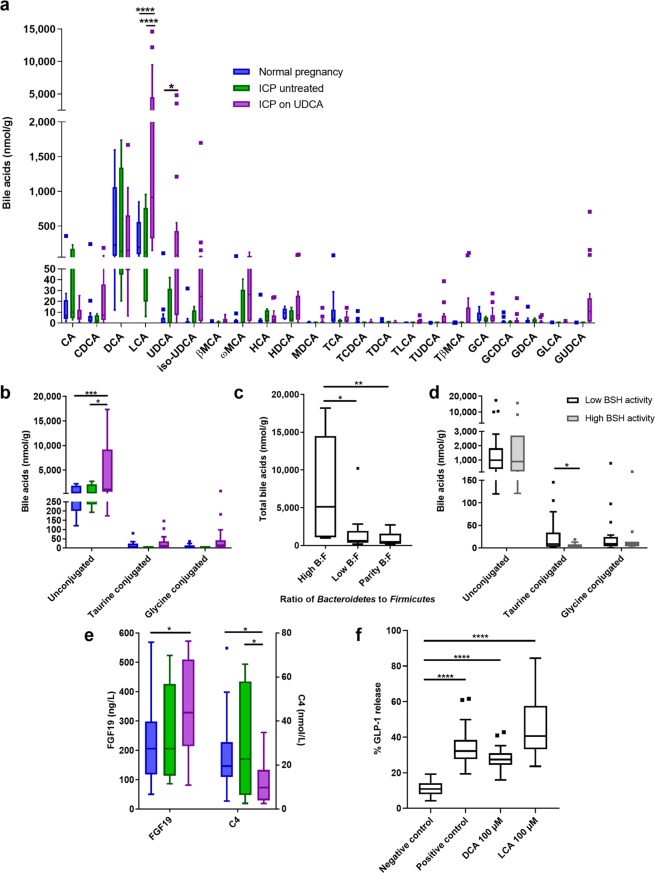
Figure 2.
Women treated with ursodeoxycholic acid for cholestatic pregnancy have altered faecal bile acids and enhanced enterohepatic feedback. (a) Faecal bile acids from women in the third trimester of uncomplicated pregnancy (blue boxes, n = 14), untreated ICP (green boxes, n = 4), and ICP treated UDCA (purple boxes, n = 17). Groups were compared with 2-way ANOVA with Tukey’s multiple comparisons test; ****adjusted p < 0.0001, *adjusted p = 0.0294. CA: cholic acid, CDCA: chenodeoxycholic acid, DCA: deoxycholic acid, LCA: lithocholic acid, MCA: muricholic acid, HCA: hyocholic acid, HDCA: hyodeoxycholic acid, MDCA: murideoxycholic acid, TCA: taurocholic acid, TCDCA: taurochenodeoxycholic acid, TDCA: taurodeoxycholic acid, TLCA: taurolithocholic acid, TUDCA: tauroursodeoxycholic acid, TβMCA: taurobetamuricholic acid, GCA: glycocholic acid, GCDCA: glycochenodeoxycholic acid, GDCA: glycodeoxycholic acid, GLCA: glycolithocholic acid, GUDCA: glycoursodeoxycholic acid. (b) Faecal bile acids by conjugation, from samples as per (a). Groups were compared with 2-way ANOVA with Tukey’s multiple comparisons test; ***adjusted p = 0.0003, *adjusted p = 0.0277. (c) Faecal bile acid levels according to ratio of Bacteroidetes to Firmicutes (B:F), determined by unsupervised clustering, from samples as per (a). Groups compared with Kruskal-Wallis test with Dunn’s multiple comparisons test; **adjusted p = 0.0086, *adjusted p = 0.0470. (d) Faecal bile acid levels by conjugation according to bile salt hydrolase (BSH) activity. Low BSH activity (white boxes): 0.00–0.83 nmol DCA/mg/min (n = 24), high BSH activity (grey boxes): 2.23–5.31 nmol DCA/mg/min (n = 11). Groups compared with Mann-Whitney tests, *p = 0.0106. (e) Serum fibroblast growth factor 19 (FGF19) and 7α-hydroxy-4-cholesten-3-one (C4) concentrations from women in the third trimester of uncomplicated pregnancy (blue boxes, n = 24), untreated ICP (green boxes, n = 10) and UDCA-treated ICP (purple boxes, n = 10). Samples were taken at 15:00, following a standardized diet for 21 hours. Groups compared with multiple t tests, and Holm-Sidak correction for multiple testing. For FGF19: *p = 0.0302, for C4: normal vs ICP on UDCA *p = 0.0296, ICP untreated vs ICP on UDCA *p = 0.0335. (f) Percentage of glucagon-like peptide one (GLP1) released from murine colonic tissue on exposure to the bile acids LCA and DCA. Negative control – buffer only, positive control: 10 µM 3-isobutyl-1-methylxanthine (IBMX) with 10 µM forskolin (n = 4, with 7–8 replicates per experiment). Boxes show median and interquartile range (IQR), with whiskers at 1.5 IQR.

