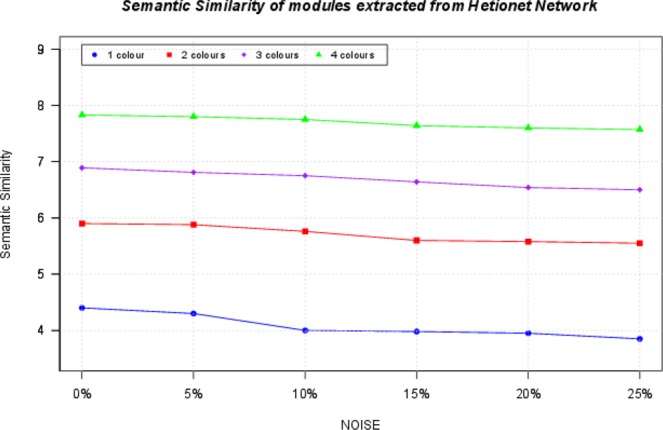
Figure 10.

The Figure shows the average semantic similarity of modules. SS measures are used to quantify the functional similarity among biological entities using the annotations contained in biological entities. For each module, we extracted functional annotations contained in Gene Ontology. Then we used the Resnick measure to evaluate the semantic similarity of each module by considering all pairs of entities inside. Finally, we averaged this quantity for all the modules of an alignment. The figure shows that considering colours of the networks produce better results in terms of functional similarity.
