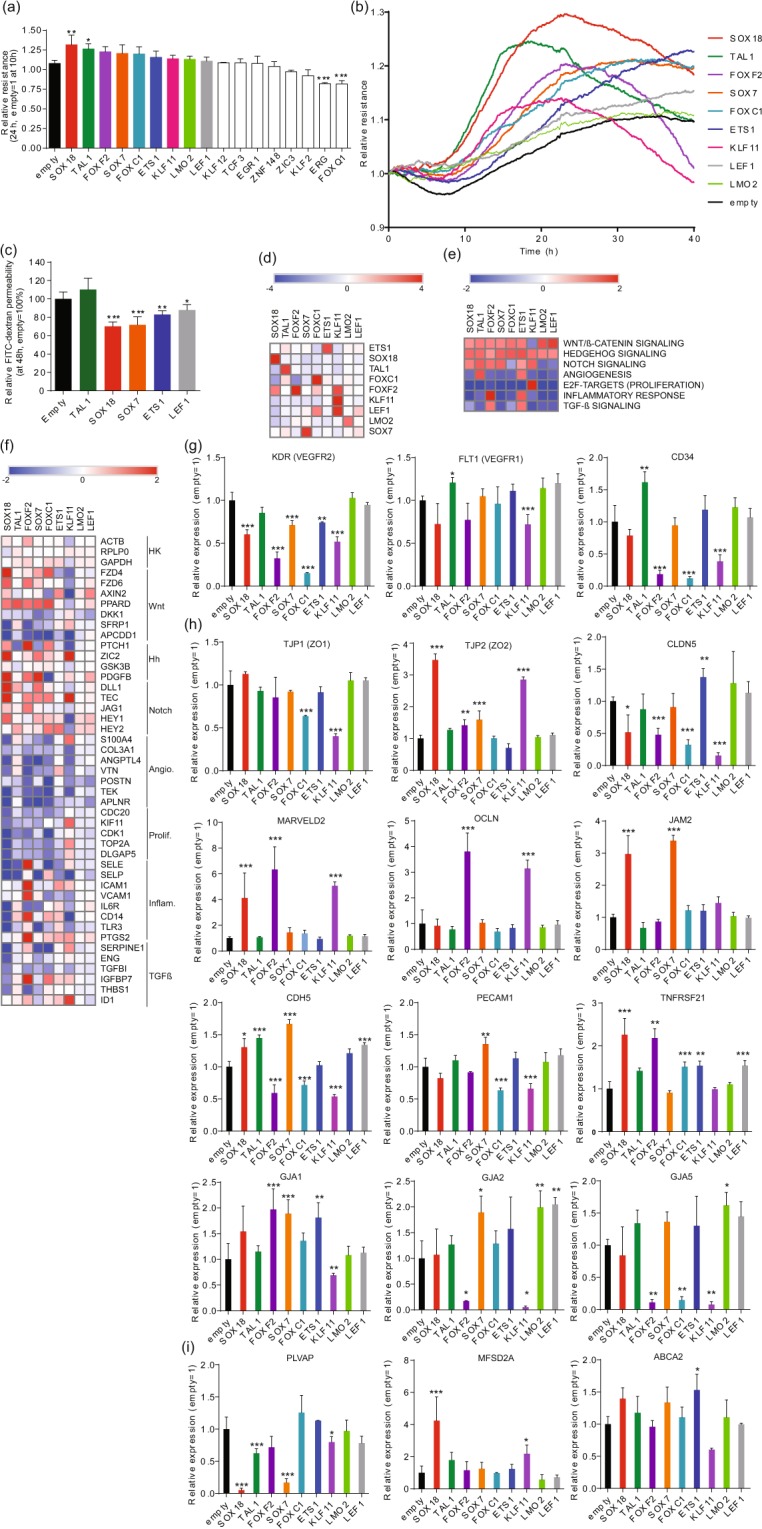
Figure 1.

Identification of transcription factors that promote endothelial barrier resistance. (a) Mean relative barrier resistance at 24 h (80 MOI adenovirus) post-stabilization of the resistance measurement (measured post-stabilization of resistance measurement, which happens at 10 h after transduction); averages are from 3 independent experiments measured using ECIS. (b) Real time ECIS measurements for each of the TFs that demonstrated a positive effect on barrier resistance at 24 h in three independent experiment (measured post-stabilization of resistance measurement, which happens at 10 h after transduction). The lines denote the mean resistance. (c) FITC-dextran permeability assay at 48 h post-transduction; averages from 3 independent experiments. (d) Heatmap of log2 fold-change expression of TFs (rows) as measured by RNA-seq at 48 h post-transduction (80 MOI adenovirus) versus adenovirus empty vector control (columns). (e) Heatmap of normalized enriched scores (NES) generated by Gene Set Enrichment Analysis (GSEA) using the hallmark gene set at the MsigDB focusing on pathways known to be involved in EC barrier formation. (f) Heatmap of log2 fold-change expression of genes annotated to pathways analyzed by GSEA. (g) Relative mRNA expression of EC marker genes, (h) EC paracellular barrier genes, and (i) Transcellular EC transporters as compared to empty vector adenovirus control. Columns represent mean ± SD. *P or FDR < 0.05, **P or FDR < 0.01, ***P or FDR < 0.001. All experiments were performed in triplicates.
