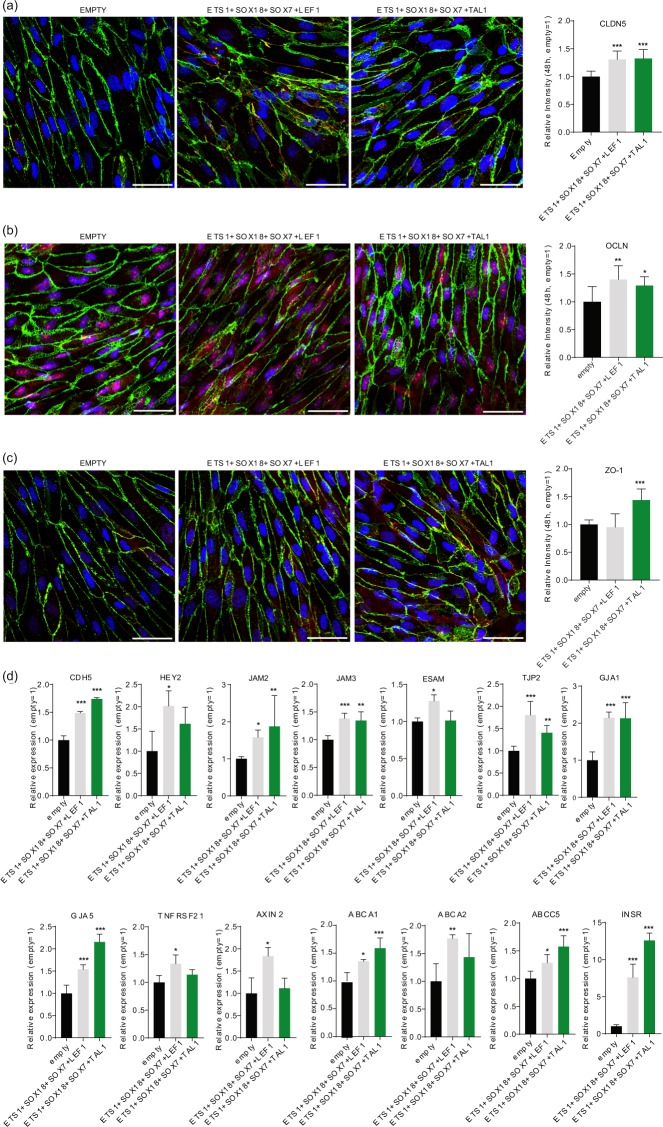
Figure 3.
Transcription factor combinations synergistically induce endothelial cell junction proteins expression and mRNA expression of EC barrier relevant genes. Immunocytochemistry with confocal imaging and ImageJ analysis of (a) CLDN5, (b) OCLN and (c) ZO1 (all in red) after 48 h treatment with combination of TFs. As EC barrier marker, VE-Cadherin was stained in green and nucleus with DAPI in blue. Scale bar represents 50 µm. (d) Relative mRNA expression of genes involved in barrier junction and transport across EC barrier after treatment with combination of TFs for 48 h. Columns are mean ± SD. All transduction were performed as 3 independent experiments. *P < 0.05, **P < 0.01, ***P < 0.001.

