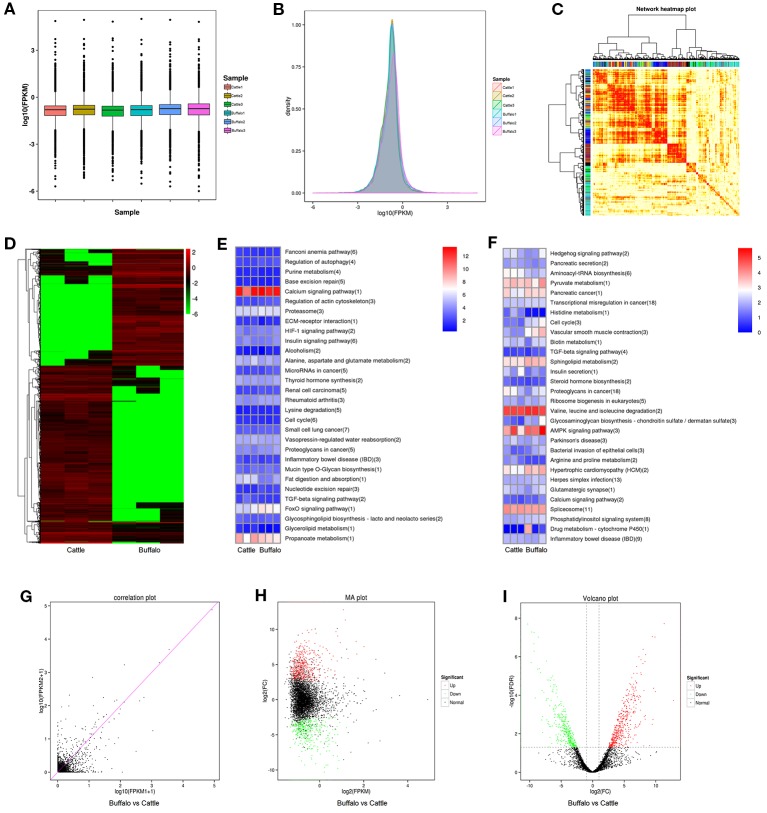
Figure 3.
Differentially expressed lncRNAs in buffalo and cattle skeletal muscle. (A, B) The expression levels of lncRNAs, plotted as fragments per kilobase of exon per million fragments mapped (FPKM). (C) Weighted gene coexpression network analysis of lncRNAs in buffalo and cattle muscle sample. (D) Heatmap of differentially expressed lncRNAs in buffalo and cattle muscle tissue. (E, F) The top 30 enriched KEGG pathways by cis (E) and trans (F) regulation. (G–I) Scatter plot, MA interactive maps and volcano plot showing the correlation between abundances of individual lncRNAs in buffalo and cattle muscle sample.

