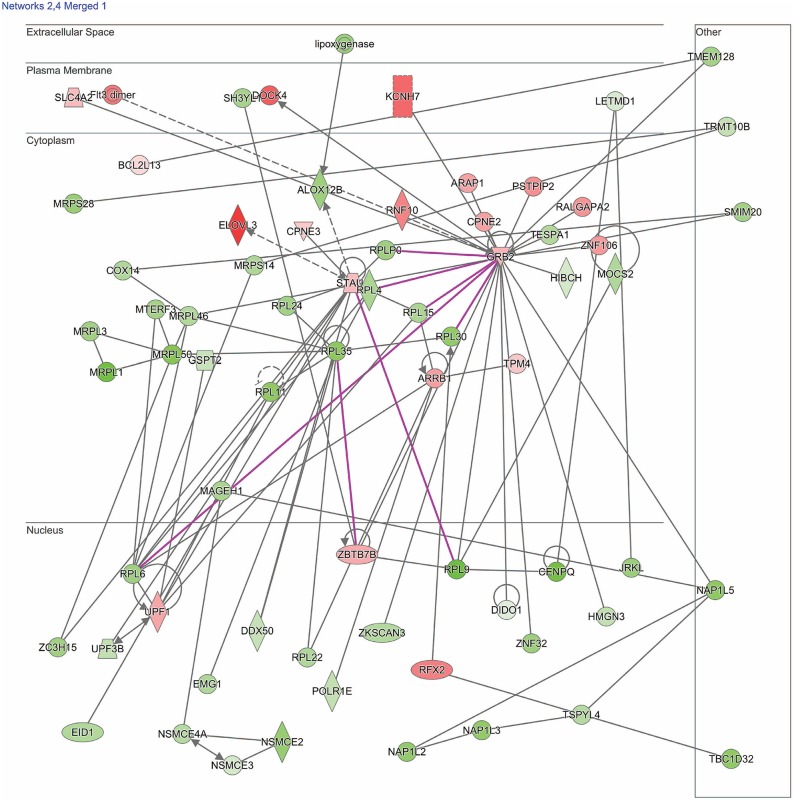
Figure 1.
Network shows dysregulated cell death and survival pathway following moderate blast. Genes described in the text included: UPF1, UPF3B, ARRB1, ZBTB7B, flt3, HIBCH, RPL6, RPL35, MRPL1, MRPL3, MRPL36, and MRPL50. Red indicates increased measurement; green represents decreased measurement; with increased color saturation representing more extreme measurement in dataset. Solid lines represent direct interactions, non-targeting interactions, or correlations between chemicals, proteins, or RNA. Dotted lines represent indirect interactions. Purple lines denote the commonly found relationship among the two merged networks. Arrowed lines represent activation, causation, expression, localization, membership, modification, molecular cleavage, phosphorylation, protein-DNA interactions, protein-RNA interactions, regulation of binding, transcription. Shapes represent molecule type (double circle, complex/group; square, cytokine; diamond, enzyme; inverted triangle, kinase; circle, other; triangle, phosphatase; oval, transcription regulator; trapezoid, transporter). The network was generated through the use of IPA (QIAGEN Inc., https://www.qiagenbioinformatics.com/products/ingenuity-pathway-analysis).

