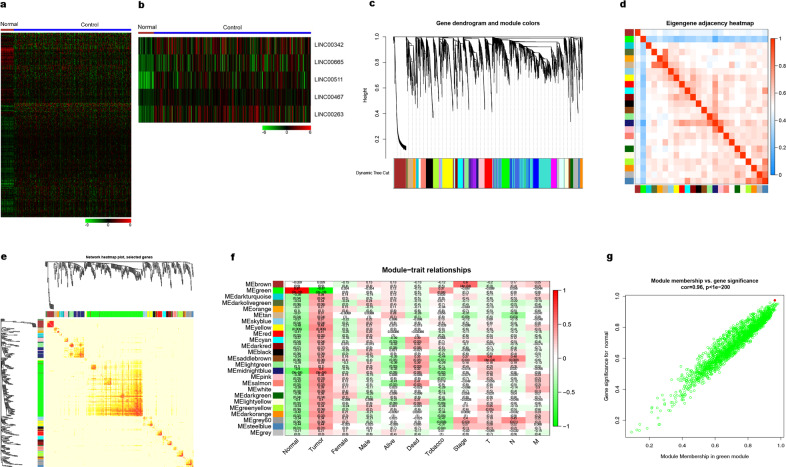
Fig. 1. Bioinformatic analysis of lung ADC from the TCGA database.
a, b Heatmap of the differentially expressed genes in lung ADC a 612 differentially expressed lncRNAs with 489 upregulated and 123 downregulated. b The top five lncRNAs with highest expression. c Differentially expressed gene clustering and module screening based on gene expression patterns of 30 lung ADC samples. Gene dendrogram obtained by clustering the dissimilarity based on consensus Topological Overlap with the corresponding module colors indicated by the color row. The top is the gene dendrogram and the bottom is the gene modules with different colors. A total of 25 modules were identified. d, e Heatmap of the correlation coefficient expressed between modules. Red represents high adjacency (positive correlation) and blue represents low adjacency (negative correlation). f Relationships of consensus module eigengenes and different traits such as normal, tumor, male, female, alive, dead, tobacco, stage, and TNM. Each row in the table corresponds to a module, and each column to a trait. Numbers in the table report the correlations of the corresponding module eigengenes and traits, with the P-values printed below the correlations in parentheses. The table is color coded by correlation according to the color legend. The intensity and direction of correlations are indicated on the right side of the heatmap (red, positively correlated; green, negatively correlated). g Analogous scatter plots for the green module. The gene significance for a tumor (y-axis) is strongly correlated with module membership in the green module (x-axis) cor = 0.96, P < 1e−200. The red dot represents LINC00263 (GS = 0.930878, MM = 0.92419).

