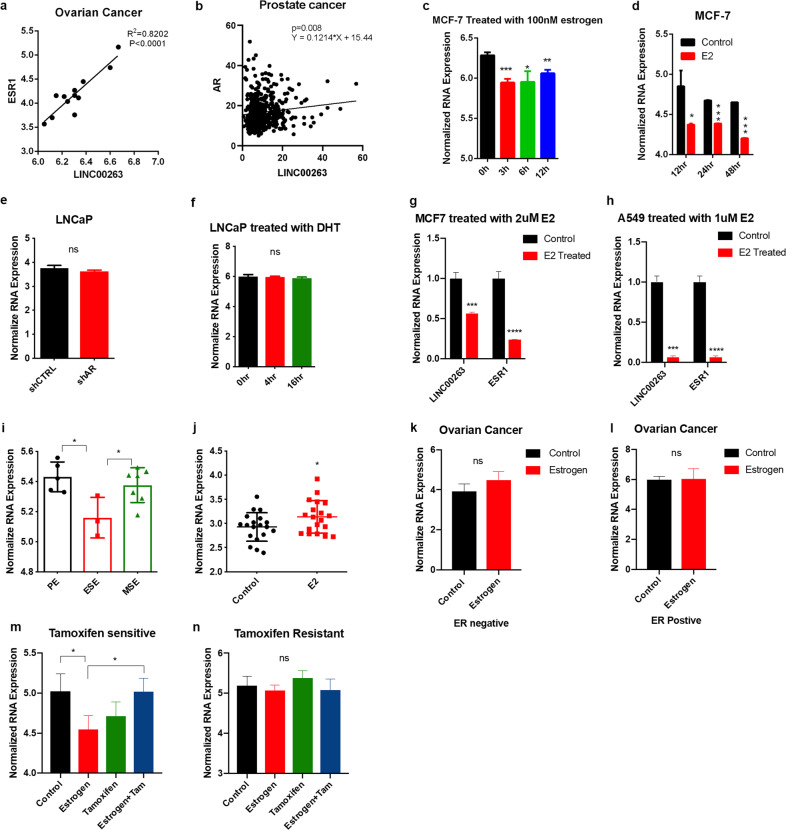
Fig. 6. LINC00263 links with estrogen.
a Correlation between ESR1 mRNA and LINC00263 LncRNA levels in ovarian cancer. Data from GEO database (GSE14407). b Correlation between AR mRNA and LINC00263 LncRNA levels in prostate cancer. Data from TCGA database. c, d The expression of LINC00263 in MCF-7 cells after treatment with 100 nM estrogen (GSE119087) c or estradiol (GSE11352) d from the GEO database. e The expression of LINC00263 in LNCaP cells after AR gene knock down. Data from GEO database (GSE11428). f The expression of LINC00263 in LNCaP cells after DHT treatment. Data from the GEO database (GSE7868). g, h RT-qPCR analysis was conducted to detect the level of LINC00263 after treatment with E2 in MCF-7 cells g and A549 cells h. i The expression of LINC00263 in normal women during the menstrual cycle. Data from the GEO database (GSE6364). j The expression of LINC00263 in the vagina of postmenopausal women after treatment with E2. Data from the GEO database (GSE11622). k, l the expression of LINC00263 in ER negative k or ER positive l ovarian cells after treatment with E2. Data from the GEO database (GSE22600). m, n The expression of LINC00263 in tamoxifen-sensitive m and tamoxifen-resistant n after treatment with E2 or tamoxifen or E2 and tamoxifen. Data from the GEO database (GSE26459). Data are shown as the mean ± SEM; n ≥ 3 independent experiments, two-tailed Student’s t-test: ns nonsignificant (P > 0.05), *P < 0.05, **P < 0.01, ***P < 0.001.

