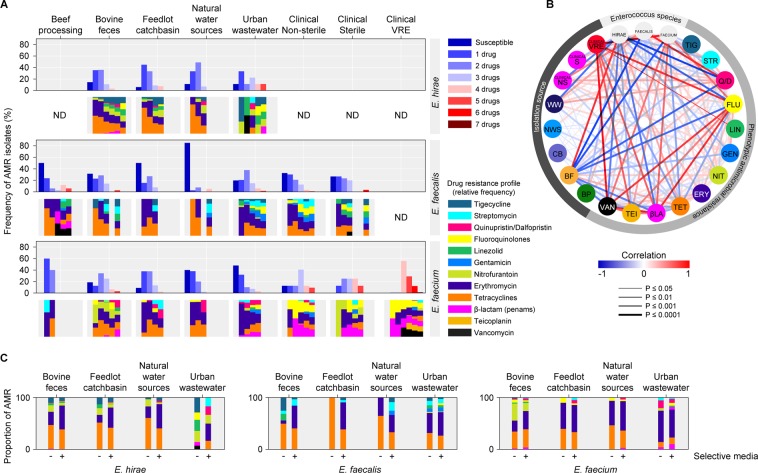
Figure 2.
(A) Overall frequency of AMR phenotypes in enterococci species isolates from across the one-health continuum. Upper panels for E. hirae, E. faecalis and E. faecium indicate prevalence of resistance to various numbers of drugs, while lower panels indicate drug resistance class profiles; (B) Correlation between isolation sources, Enterococcus species and antimicrobial resistance phenotypes (a measure of association was determined through Pearson’s correlation analysis); (C) Comparison of proportion of phenotypic AMR between enterococci isolated on antibiotic-free and macrolide (erythromycin) selective media. BP, beef processing (abattoir & retail meat); BF, bovine feces; CB, catch basin; NWS, natural water source; WW, waste water; clinical NS, clinical non-sterile; clinical S, clinical sterile; clinical VRE, clinical vancomycin resistant. ND (not detected/not determined/no data) indicates lack of data-points due to the absence or low detection of a particular Enterococcus species in a sector of continuum.

