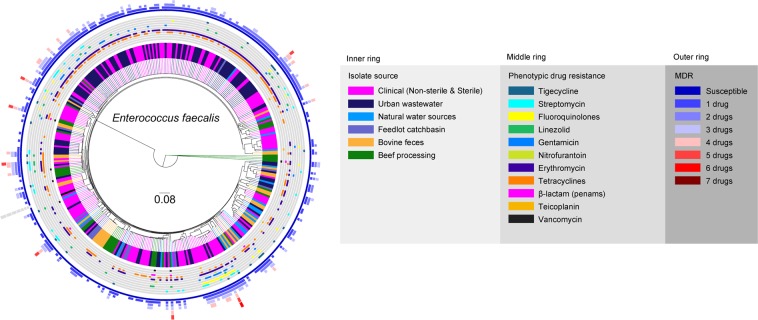
Figure 3.
Phylogenomic relatedness tree constructed based on analysis of single-nucleotide polymorphisms (SNPs) of the core genes of E. faecalis genomes (n = 366) isolated from various environments and samples related to beef production and processing systems, environment, and human-related sources. The genomes were compared using E. faecalis OG1RF genome (GenBank accession # NC_004668/CP002621.1) as a reference. Phylogenomic analysis of the WGS data was conducted using SNVPhyl87 and the resulting newick tree file was visualized in FigTree v1.4.4 (http://tree.bio.ed.ac.uk/software/figtree/) to obtain phylogenomic dendrogram.

