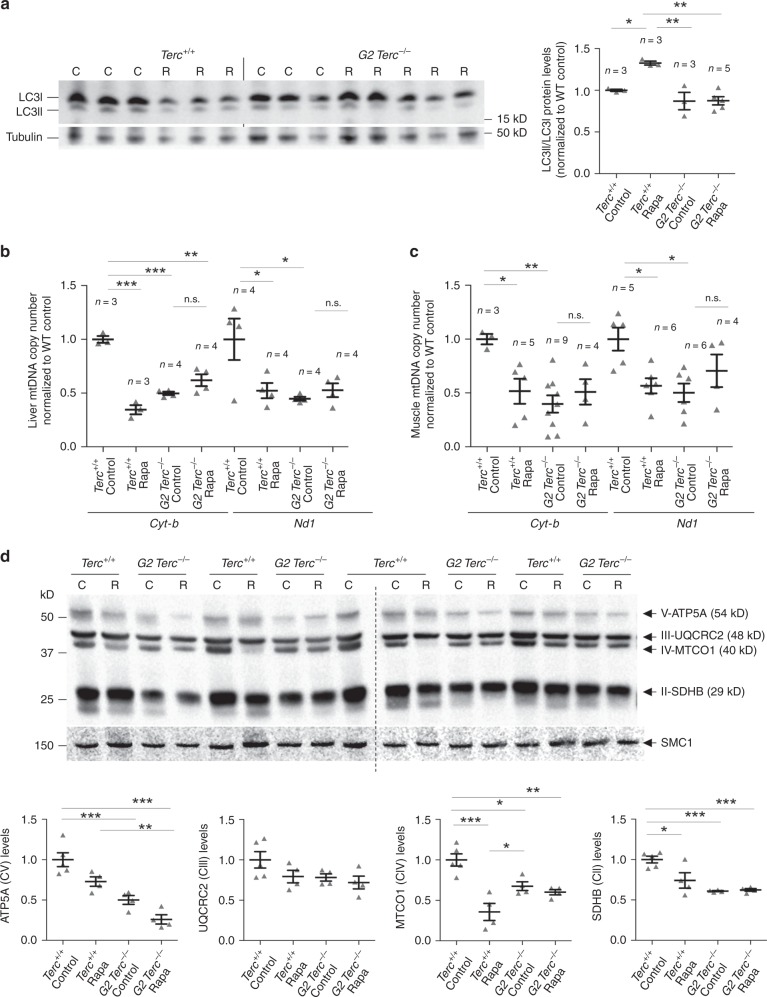
Fig. 4. Worsened mitochondrial function in rapamycin-treated wild-type mice.
a Western blot representative images (left panel) and quantification (right panel) of LC3 protein levels, LC3-I and LC3-II forms (LC3-II/LC3-I ratio), and tubulin as a loading control from hepatic protein extracts from healthy male Terc+/+ and G2 Terc−/− mice fed rapamycin or control diet during 2 months. b, c Mitochondrial DNA copy number as defined by analysis of the Cyt-b and Nd1 mitochondrial genes in liver (b) and skeletal muscle (c) from rapamycin or control fed Terc+/+ and G2 Terc−/− mice at the HEP. d Western blot representative images (upper panel) and quantification (lower panel) of the OXPHOS complexes V (ATP5A), III (UQCRC2), IV (MTCO1), and II (SDHB) protein levels in liver from rapamycin- or control-fed Terc+/+ and G2 Terc−/− mice at the HEP. Error bars represent the SE. n = number of mice. Statistical significance was determined by one-way Anova with post hoc Tukey test. *p ≤ 0.05; **p ≤ 0.01; ***p ≤ 0.001; n.s. not significant. Source data are provided as a Source Data file.

