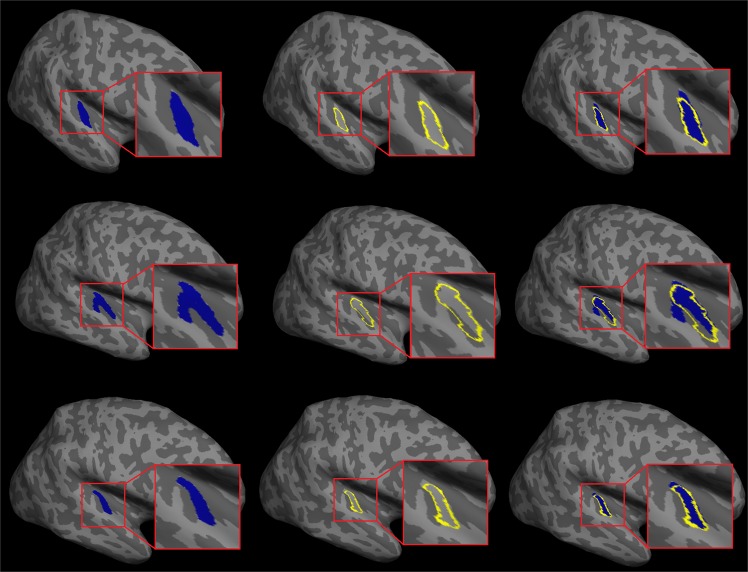
Figure 2.
Examples of TASH (left, in blue) and FreeSurfer (middle, yellow outlines) HG segmentations in the right hemispheres of three representative participants, and the overlays of these (right). Light grey regions depict gyri and dark grey ones depict sulci. Red squares on the right of each panel show zoomed-in views of the auditory cortex. Top: single transverse temporal gyrus (HG), middle: common stem duplication (CSD), bottom: full posterior duplication (FPD).

