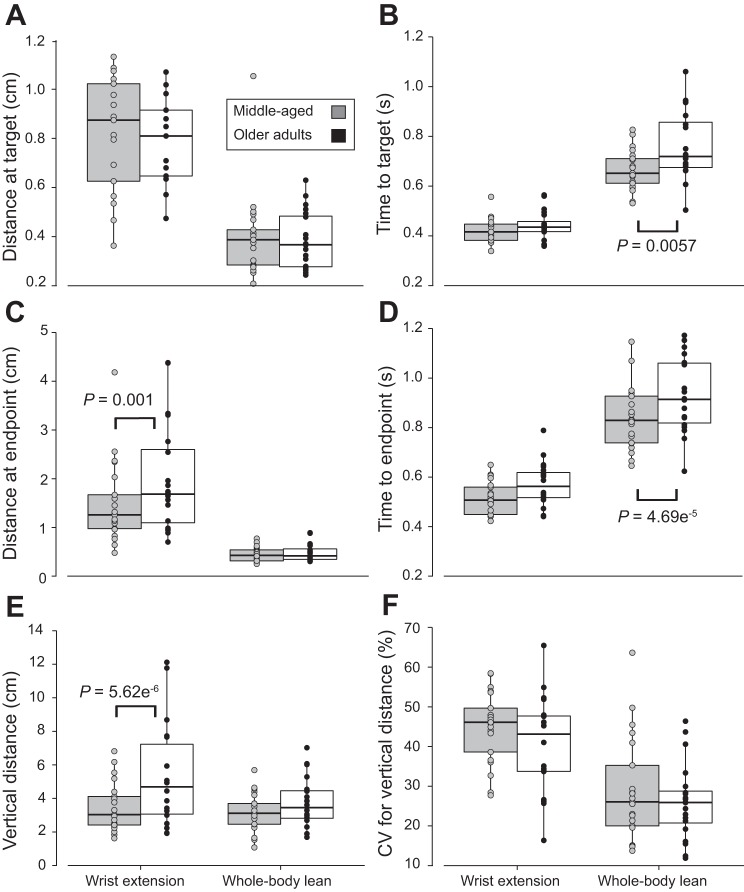
Fig. 4.
Box plots showing distance and time measures for the movement-variability tasks of the middle-aged and older adults. A: mediolateral distance (cm) at the target. B: time (s) to reach the target. C: mediolateral distance (cm) at the endpoint. D: time (s) to reach the endpoint. E: maximal vertical distance at the endpoint (cm). F: coefficient of variation (CV) for maximal vertical distance (%). Horizontal lines of the box plot represent quartiles (25th, 50th, and 75th percentiles) of the distribution. Gray circles indicate middle-aged adults; black circles indicate older adults.

