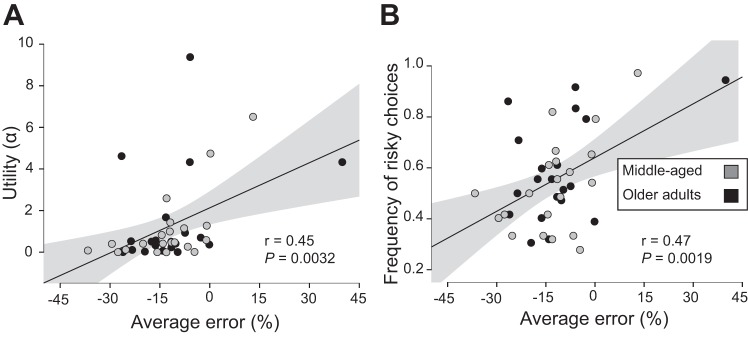
Fig. 5.
Pearson’s r between measures derived from cumulative prospect theory and measures of performance variability for the wrist-extension task. Utility (α) denotes risk sensitivity with α < 1 showing risk-averse behavior and α > 1 showing risk-seeking behavior. Frequency of risky choices was quantified as the ratio of number of times the riskier option was chosen. The average error between the verbal response and actual probability (average difference) provides a directional assessment of underestimating (negative) or overestimating (positive) motor variability. A: average error of the perceived probability and utility (α). B: average error of the perceived probability and the frequency of risky choices. Gray circles indicate middle-aged adults; black circles indicate older adults. Shaded area about the regression line denotes the SE of the regression.

