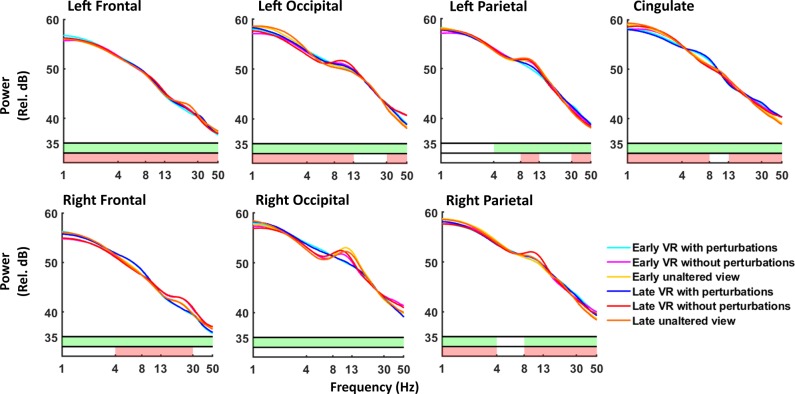
Fig. 6.
Spectral power across groups. Average EEG spectral power is shown for the 7 regions of interest during the first (early) and last (late) 5 min of training for both virtual reality training groups and the unaltered view group (n = 10 for each group). Average spectral power is shown for virtual reality with perturbations during early (cyan) and late (blue) training. For virtual reality without perturbations, early training is shown in magenta with late training in red. Early training with unaltered view is shown in yellow, with late training in orange. We plotted across frequencies from 1 to 50 Hz. Shaded areas at the bottom denote significant differences in spectral power between groups, as compared across 85 randomly selected time bins for each subject, using nonparametric 3×2 ANOVA comparisons using permutation statistics. Green shading corresponds to a significant main effect of group (virtual reality with perturbation vs. virtual reality without perturbation vs. unaltered viewing). Red shading corresponds to a significant main effect of training (early vs. late).

