
Fig. 1.
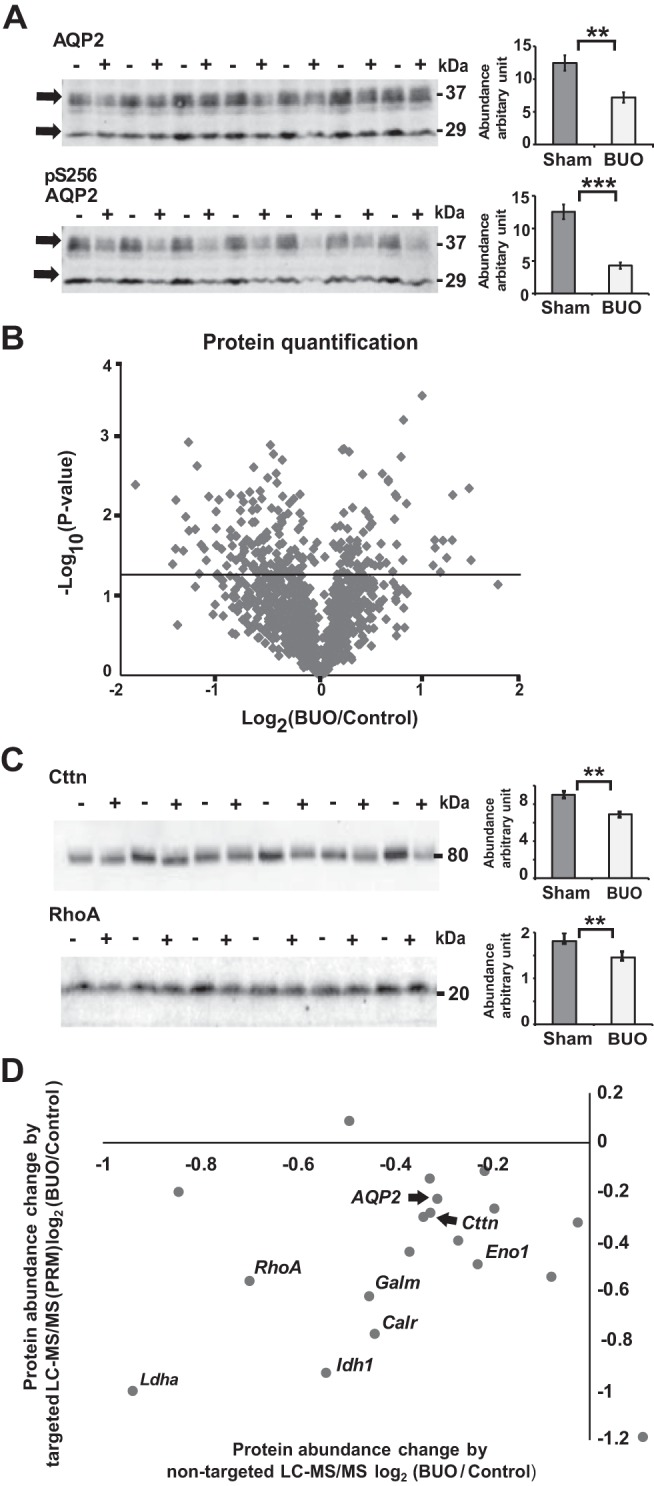
Immunoblot and proteomic analyses of the inner medulla and inner medullary collecting duct (IMCD) from 4-h bilateral ureteral obstruction (BUO) and sham rats and data verification. A: densitometry analysis revealed significant downregulation of total aquaporin 2 (AQP2) and phospho-Ser256 (pS256) AQP2 by 42% (**P < 0.005) and 65% (***P < 0.001) in 4-h BUO (+; n = 6) compared with sham (−; n = 6) rats, respectively (unpaired t tests). B: proteomic analysis of IMCD proteins from 4-h BUO and sham rats from 3 independent experiments. The volcano plot demonstrates the average log2 protein abundance ratio of BUO to sham groups for 1,046 proteins identified in all 3 biological replicates (x-axis) versus the significance, expressed as –log10 (P value, y-axis). The horizontal solid line indicates a P value of 0.05 [−log (P value) of 1.3]. A total of 215 proteins showed significant changes in abundance in 4-h BUO IMCDs compared with sham IMCDs (unpaired t tests, P < 0.05, above the solid line). C: immunoblot analysis of inner medulla samples from sham (−; n = 6) and 4-h BUO (+; n = 6) rats probed with RhoA and cortactin (Cttn) antibodies. Densitometry analysis revealed 20% downregulation of RhoA (unpaired t tests, **P < 0.01) and 23% downregulation of Cttn in 4-h BUO compared with sham rats. D: the x-axis represents the mean of the log2 value of the protein abundance ratio for paired 4-h BUO and sham rats [two-tailed t test against log2 (1), P < 0.05] resulting from nontargeted liquid chromatography-tandem mass spectrometry (LC-MS/MS) analysis from 3 independent experiments. The y-axis represents the mean of the log2 value of the protein abundance ratio of the same proteins verified by targeted LC-MS/MS from 3 independent experiments [two-tailed t test against log2 (1), P < 0.05]. See text for definitions of abbreviations.