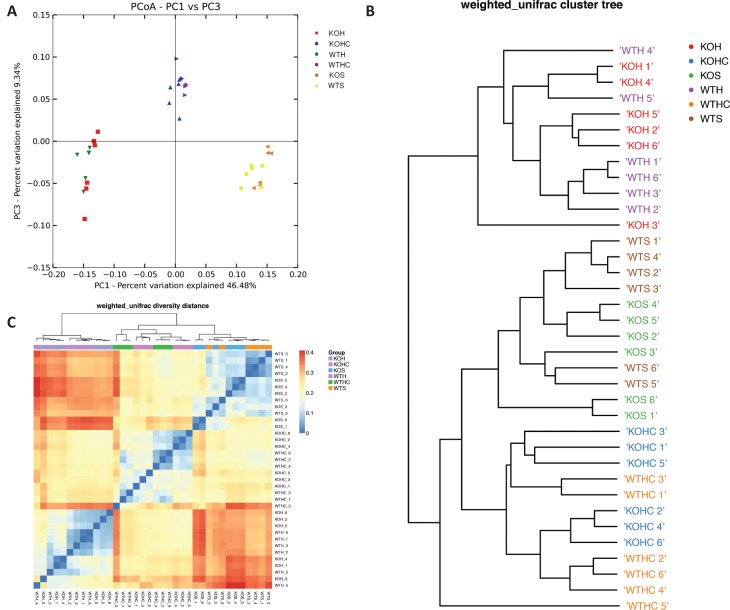
Fig. 3.
CAP modulated the structure of the gut microbiota. (A) Principal coordinate analysis (PCoA) and (B) sample clustering results of the weighted UniFrac distances of microbial 16S rRNA sequences from the V4 region in fecal samples, (C) heat map representation of hierarchical cluster. WTH, WT mice fed with high-fat diet; WTHC, WT mice fed with high-fat diet and CAP; KOS, KO mice fed with low fat diet; KOH, KO mice fed with high-fat diet; KOHC, KO mice fed with high-fat diet and CAP.

