
Figure 4. GaMTs are more polarized and contain less intersections.
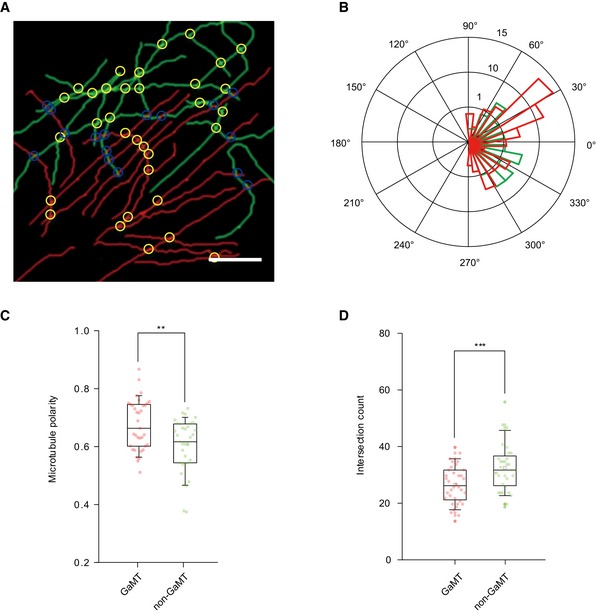
- A representative image of MT networks extracted from MT STORM image of an HRPE cell. Red line: GaMT; green line: non‐GaMT. Yellow circle: intersection. Blue circle: intersections formed by GaMTs and non‐GaMTs. Scale bar: 5 μm.
- Rose‐plot presents the orientation of GaMTs and non‐GaMTs. Red: GaMTs; green: non‐GaMTs.
- Box–whisker plot presents the projections of GaMTs and non‐GaMTs to the leading edge direction (data were pooled from three independent experiments and n = 36 cells). The ends of the whiskers are set at 10 and 90% of the entire population, **P < 0.01, unpaired t‐test.
- Box–whisker plot presents the intersection counts of GaMTs and non‐GaMTs (data are pooled from three independent experiments and n = 36 cells). The ends of the whiskers are set at 10 and 90% of the entire population, ***P < 0.001, unpaired t‐test.
Source data are available online for this figure.