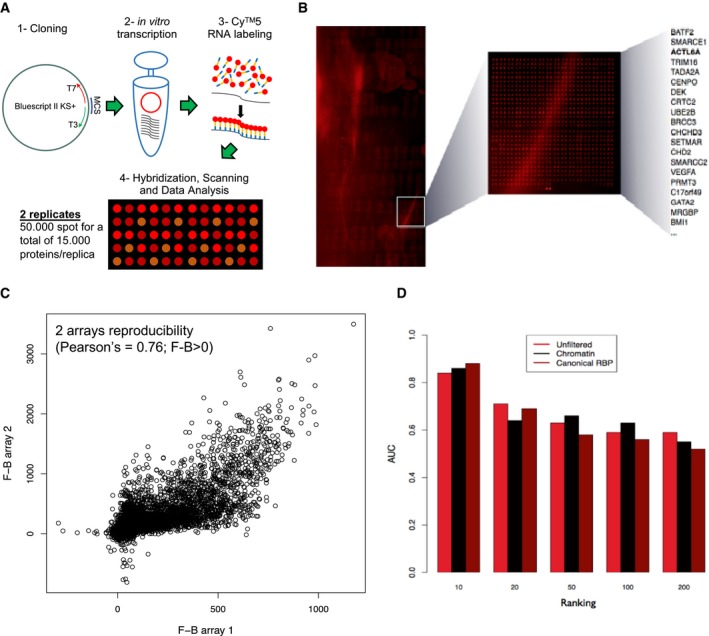
Area under ROC curve (AUC) to assess Global Score
34 ability to separate proteins interacting with uc.291 from those that are non‐interacting. The F‐B score was employed to select different groups of high‐affinity (top ranked) and low‐affinity (bottom ranked) interactions reported in the array: (1) RBP, (2) chromatin‐related and (3) unfiltered (i.e. without selecting by category). In all cases, Global Score performances increase from poor signal (top/bottom 200) to strong signal (top/bottom 10) interactions, showing AUCs that raise from 0.60 to 0.80.