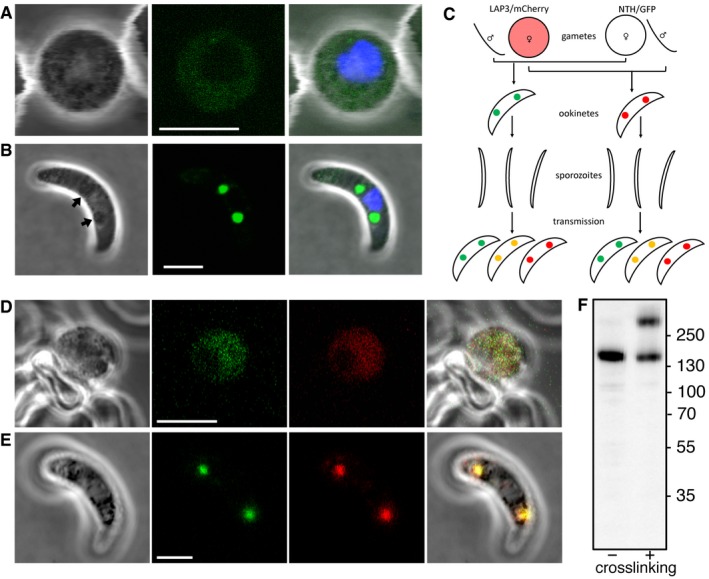
Brightfield and fluorescence images of a NTH/GFP zygote at 4 h post‐fertilisation, showing dispersed extranuclear fluorescence. Hoechst DNA staining (blue) marks nucleus. Scale bar = 5 μm.
Image of an NTH/GFP ookinete, showing fluorescent spots co‐localising with pigment clusters (arrows). Hoechst DNA staining (blue) marks nucleus. Scale bar = 5 μm.
Schematic diagram of a genetic cross between parasite lines NTH/GFP and LAP3/mCherry and the resultant ookinete population after mosquito transmission and drug selection (oocysts, liver, and blood‐stage parasites not shown). Colours represent NTH::GFP (green), LAP3::mCherry (red), and their co‐localisation (orange). Spots in ookinetes depict crystalloids. Self‐fertilisation events are omitted.
Brightfield and fluorescence images of a zygote at 4 h post‐fertilisation simultaneously expressing NTH::GFP (green) and LAP3::mCherry (red). Scale bar = 5 μm.
An ookinete simultaneously expressing NTH::GFP (green) and LAP3::mCherry (red), showing co‐localisation in the crystalloid. Scale bar = 5 μm.
Western blot of purified NTH/GFP ookinete samples with (+) and without (−) prior in vivo crosslinking. M
r markers (kDa) are indicated on the right‐hand side.

