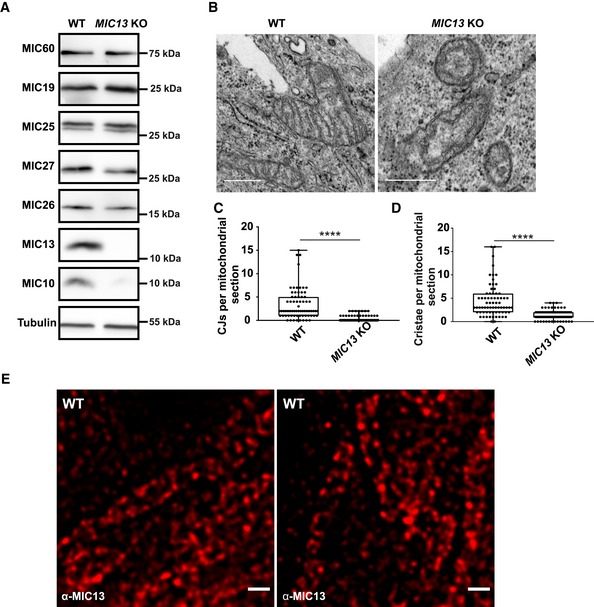
Figure EV1. Deletion of MIC13 in HeLa cells leads to a loss of crista junctions.

-
AWestern blot analysis of WT and MIC13 KO HeLa cells showing a reduction in MIC10, MIC26 and MIC27 protein levels in MIC13 KOs.
-
BRepresentative electron micrographs of WT and MIC13 KO HeLa cells show loss of CJs in MIC13 KOs. Scale bar 500 nm.
-
CBoxplot showing quantification of CJs per mitochondrial section from different mitochondria in WT and MIC13 KO HeLa cells represented as boxplots. Boxplots show median and interquartile range from 25 to 75 percentile, and whiskers represent minimum and maximum value. Data from n = 70–90 mitochondria (from two independent experiments) are shown as data points in the boxplots. ****P < 0.0001 (WT versus MIC13 KO), unpaired Student's t‐test.
-
DBoxplot showing quantification of cristae per mitochondrial section in WT and MIC13 KO HeLa cells represented as boxplots. Boxplots show median and interquartile range from 25 to 75 percentile, and whiskers represent minimum and maximum value. Data from n = 70–90 mitochondria (from two independent experiments) are shown as data points in the boxplots. ****P < 0.0001, unpaired Student's t‐test.
-
ERepresentative STED super‐resolution images of WT HeLa cells stained with anti‐MIC13 antibody shows punctate distribution of MIC13. Scale bar 500 nm.
