
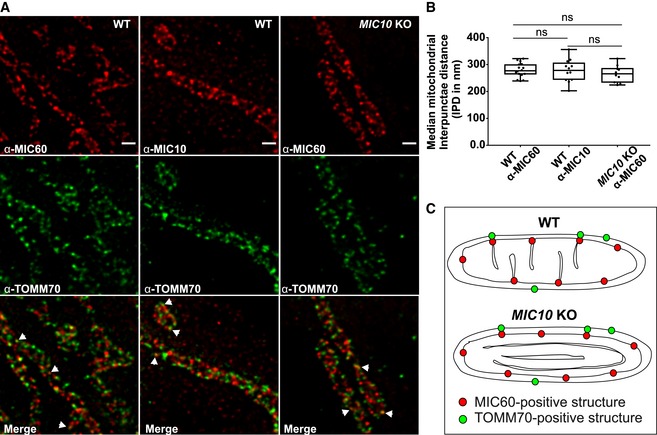
Figure 2. MIC60 assembles as regularly spaced punctae in the absence of CJs.
-
ARepresentative STED super‐resolution images of WT and MIC10 KO HAP1 cells immunostained with MIC60 or MIC10 antibodies (top panel) and TOMM70 (middle panel). Bottom panel shows merged images. Arrowheads show colocalization of MIC60 and TOMM70 punctae. Scale bar 500 nm.
-
BQuantification of median interpunctae distance (IPD) per mitochondrion between MIC60 and MIC10 punctae in indicated cell lines represented by boxplots. Boxplots show median and interquartile range from 25 to 75 percentile, and whiskers represent minimum and maximum value. Median IPD from n = 10–16 mitochondria (from two independent experiments) is shown as data points in the boxplots. ns, not significant, unpaired Student's t‐test.
-
CScheme shows MIC60 marking the nascent sites of CJ formation independent of MIC10 and presence of contact sites in WT and MIC10 KO HAP1 cells shown by colocalization of MIC60 and TOMM70.