-
A–D
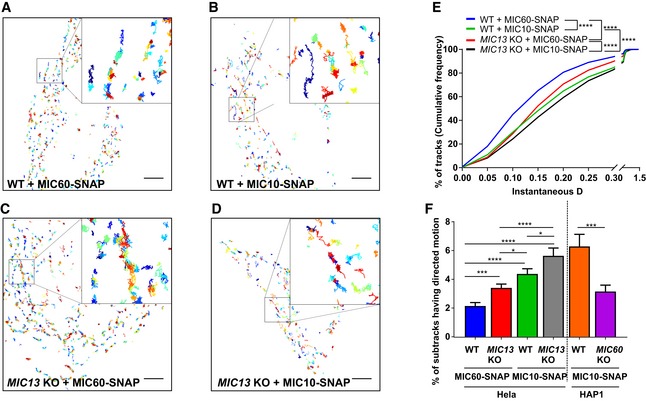
Representative single‐particle tracks of cells expressing MIC60‐ (A) and MIC10‐SNAP (B) in WT HeLa cells and MIC60‐ (C) and MIC10‐SNAP (D) in MIC13 KO HeLa cells, stained with silicon rhodamine dye and imaged at a rate of 33 ms/frame. Single tracks were colour‐coded according to temporal appearance. Scale Bar 5 μm. Insets in each image show zoomed‐in images of few representative tracks.
-
E
Cumulative frequency of tracks having corresponding values of instantaneous diffusion coefficients (insD) in WT and MIC13 KO HeLa cells expressing MIC60‐ and MIC10‐SNAP stained with silicon rhodamine. Number of tracks analysed (obtained from two independent experiments): n = 2,541, 2,540, 3,560 and 1,441 in WT HeLa cells expressing MIC60‐SNAP and MIC10‐SNAP, MIC13 KO HeLa cells expressing MIC60‐SNAP and MIC10‐SNAP, respectively. (****P ≤ 0.0001 for all possible comparisons, unpaired Student's t‐test).
-
F
Percentage of subtracks having directed motion in WT and MIC13 KO HeLa cells expressing MIC60‐ and MIC10‐SNAP and in WT and MIC60 KO HAP1 cells expressing MIC10‐SNAP. Number of corresponding subtracks analysed (obtained from two independent experiments): n = 2,561, 2,443, 3,402, 1,360, 561 and 1,110. Data are mean ± SEM. *P ≤ 0.05, ***P ≤ 0.001, ****P ≤ 0.0001, unpaired Student's t‐test.

