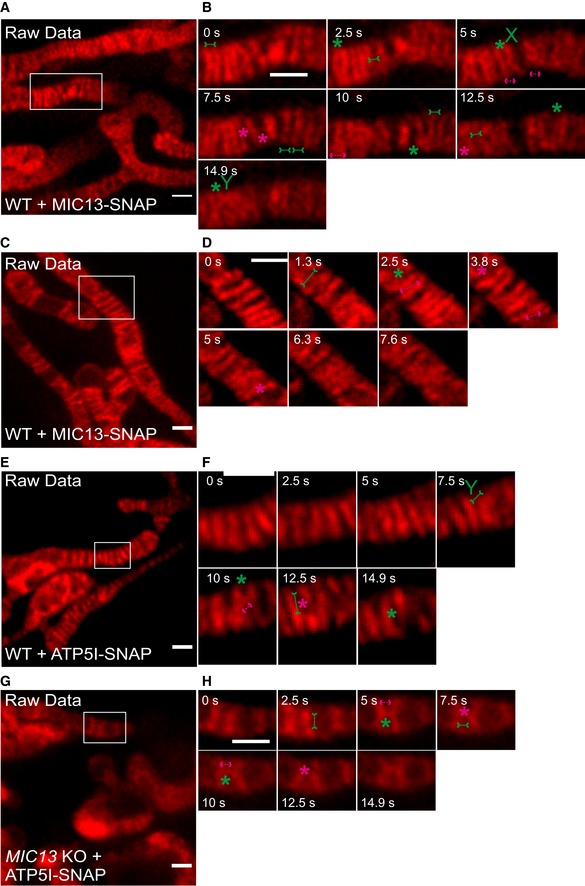
Figure EV4. Raw data of CJ and cristae dynamics.

-
ARaw data of live‐cell STED super‐resolution images (t = 0 s) showing WT HeLa cells expressing MIC13‐SNAP stained with silicon rhodamine. Box in (A) marks selection shown as a zoom in panel (B). Raw data used for Fig 6A. Scale bar 500 nm.
-
BRaw data of time‐lapse image series of a mitochondrion expressing MIC13‐SNAP in WT HeLa cells (2.5 s/frame). Green and magenta asterisks show merging and splitting events of cristae, respectively. Green arrows pointing inward connected by solid line and magenta arrows pointing outward connected by dotted line show sites of imminent merging and splitting events, respectively. Green “X” and “Y” represent X‐ and Y‐type imminent mergence events. Raw data used for Fig 6B. Scale bar 500 nm.
-
CRaw data of live‐cell STED super‐resolution images (t = 0 s) showing WT HeLa cells expressing MIC13‐SNAP stained with silicon rhodamine. Box in (C) marks selection shown as a zoom in panel (D). Raw data used for Fig 6C. Scale bar 500 nm.
-
DRaw data of time‐lapse image series of a mitochondrion expressing MIC13‐SNAP in WT HeLa cells (2.5 s/frame). Green and magenta asterisks show merging and splitting events of cristae, respectively. Green arrows pointing inward connected by solid line and magenta arrows pointing outward connected by dotted line show sites of imminent merging and splitting events, respectively. Raw data used for Fig 6D. Scale bar 500 nm.
-
ERaw data of live‐cell STED super‐resolution images (t = 0 s) showing WT HeLa cells expressing ATP5I‐SNAP stained with silicon rhodamine. Box in (E) marks selection shown as a zoom in panel (F). Raw data used for Fig 7A. Scale bar 500 nm.
-
FRaw data of time‐lapse image series of a mitochondrion expressing ATP5I‐SNAP in WT HeLa cells (2.5 s/frame). Green and magenta asterisks show merging and splitting events of cristae respectively. Green arrows pointing inward connected by solid line and magenta arrows pointing outward connected by dotted line show sites of imminent merging and splitting events, respectively. Green “X” and “Y” represent X‐ and Y‐type imminent merging events. Raw data used for Fig 7B. Scale bar 500 nm.
-
GRaw data of live‐cell STED super‐resolution images (t = 0 s) showing MIC13 KO HeLa cells expressing ATP5I‐SNAP stained with silicon rhodamine. Box in (G) marks selection shown as a zoom in panel (H). Raw data used for Fig 7C. Scale bar 500 nm.
-
HRaw data of time‐lapse image series of a mitochondrion expressing ATP5I‐SNAP in MIC13 KO HeLa cells (2.5 s/frame). Green and magenta asterisks show merging and splitting events of cristae marked by ATP5I‐SNAP, respectively. Green arrows pointing inward connected by solid line and magenta arrows pointing outward connected by dotted line show sites of imminent merging and splitting events, respectively. Raw data used for Fig 7D. Scale bar 500 nm.
