
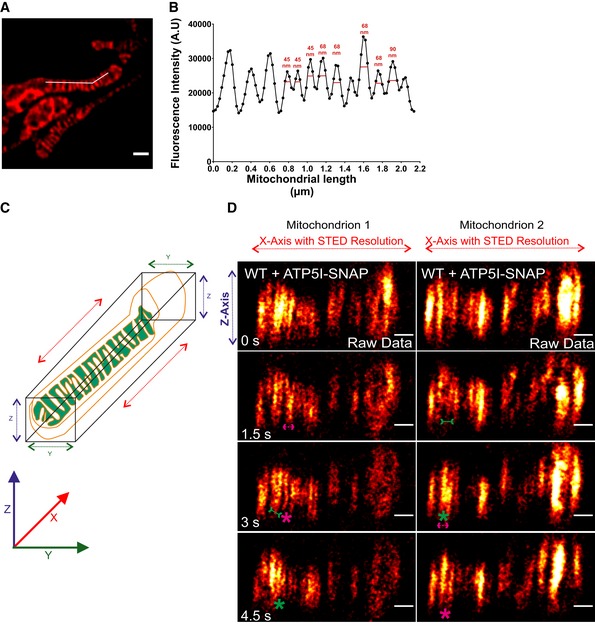
Figure EV5. Image depicting the resolution of live‐cell STED nanoscopy and axial dimension (XZ) of mitochondria showing cristae dynamics in lateral dimension (X‐axis) at STED resolution.
-
A, BLine scan (white line) along the length of mitochondria (A) from a representative live‐cell STED super‐resolution image from WT HeLa cells expressing ATP5I‐SNAP stained with silicon rhodamine marking cristae intensities (B). Image in panel (A) is already represented in Fig 7A. FWHM (full width at half maximum) of fluorescence intensities of cristae show a resolution of 50–60 nm using live‐cell STED conditions. Scale bar in (A) 500 nm.
-
CCartoon depicting the XYZ axes of mitochondria. Mitochondria were imaged by STED super‐resolution imaging in lateral axis (XY plane), while images were acquired in axial axis (XZ plane, diffraction‐limited).
-
DTime‐lapse image series of axial plane of two mitochondria expressing ATP5I‐SNAP, stained with silicon rhodamine (red hot LUT) in WT HeLa cells (raw data, 1.5 s/frame), as visualized by STED super‐resolution imaging in lateral plane. Green and magenta asterisks show merging and splitting events of cristae, respectively. Green arrows pointing inward connected by solid line and magenta arrows pointing outward connected by dotted line show sites of imminent merging and splitting events, respectively. Scale bar 500 nm.