-
A
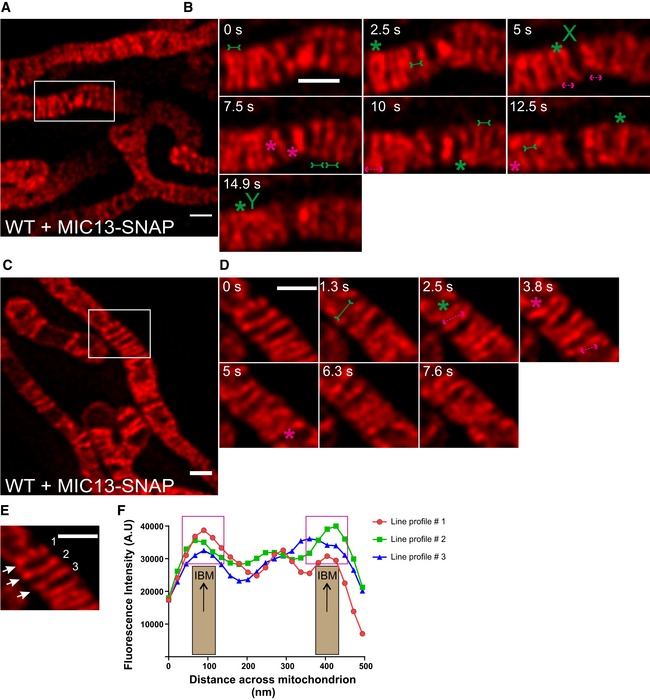
Representative live‐cell STED super‐resolution images (t = 0 s), showing WT HeLa cells expressing MIC13‐SNAP, from a time‐series of images acquired at a time interval of 2.5 s stained with silicon rhodamine. Box in (A) marks selection shown as a zoom in panel (B). Scale bar 500 nm.
-
B
Time‐lapse image series of a mitochondrion expressing MIC13‐SNAP imaged at a time interval of 2.5 s/frame. Green and magenta asterisks show cycles of cristae merging and splitting marked by MIC13‐SNAP. Green arrows pointing inward connected by solid line and magenta arrows pointing outward connected by dotted line show sites of imminent merging and splitting events, respectively. Cristae mergence events that form structure resembling letter “X” or “Y” are marked at 5 or 14.9 s, respectively. Scale bar 500 nm.
-
C
Representative live‐cell STED super‐resolution images (t=0 s), showing WT HeLa cells expressing MIC13‐SNAP, from a time‐series of images acquired at a time interval of 1.3 s stained with silicon rhodamine. Box in (C) marks selection shown as a zoom in panel (D). Scale bar 500 nm.
-
D
Time‐lapse image series of a mitochondrion expressing MIC13‐SNAP imaged at a time interval of 1.3 s/frame. Green and magenta asterisks show cycles of cristae merging and splitting marked by MIC13‐SNAP. Green arrows pointing inward connected by solid line and magenta arrows pointing outward connected by dotted line show sites of imminent merging and splitting events, respectively. Scale bar 500 nm.
-
E
First image from (D) was used for showing the intensity profiles along the length of three cristae (numbered 1–3 and marked with white arrows) in (F).
-
F
Intensity profiles of lines drawn across the length of cristae show increased intensities at the edges of the line scans representing the IBM. Magenta boxes depict intensity maxima at IBM.