
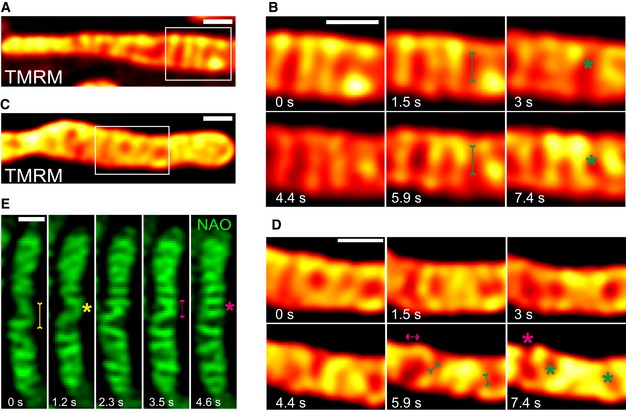
Figure 8. Cristae spatial remodelling is corroborated using mitochondrial inner membrane‐specific dyes.
-
ARepresentative live‐cell STED super‐resolution images (t = 0 s) showing WT HeLa cells stained with TMRM. Box in (A) marks selection shown as a zoom in panel (B) (red hot LUT). Scale bar 500 nm.
-
BTime‐lapse image series of two mitochondria stained with TMRM (1.5 s/frame). Green asterisks show merging events and redistribution of TMRM intensity from a high‐intensity crista to a low‐intensity crista (two such instances are shown at 3 and 7.4 s). Green arrows pointing inward connected by solid line at 1.5 and 5.9 s indicate imminent merging events. Scale bar 500 nm.
-
CRepresentative live‐cell STED super‐resolution images (t = 0 s) showing WT HeLa cells stained with TMRM. Box in (C) marks selection shown as a zoom in panel (D) (red hot LUT). Scale bar 500 nm.
-
DTime‐lapse image series of two mitochondria stained with TMRM (1.5 s/frame). Green and magenta asterisks show cristae merging and splitting cycles (shown at 5.9 s and 7.4 s). Green arrows pointing inward connected by solid line and magenta arrows pointing outward connected by dotted line show sites of imminent merging and splitting events, respectively. Scale bar 500 nm.
-
ERepresentative time‐lapse images of WT HeLa cells stained with NAO, and imaged using Airyscan microscope, indicate cristae merging and splitting dynamics. Yellow and magenta asterisks show merging and splitting events of cristae, respectively. Yellow arrows pointing inward connected by solid line and magenta arrows pointing outward connected by dotted line show sites of imminent merging and splitting events, respectively. Scale bar 500 nm.