
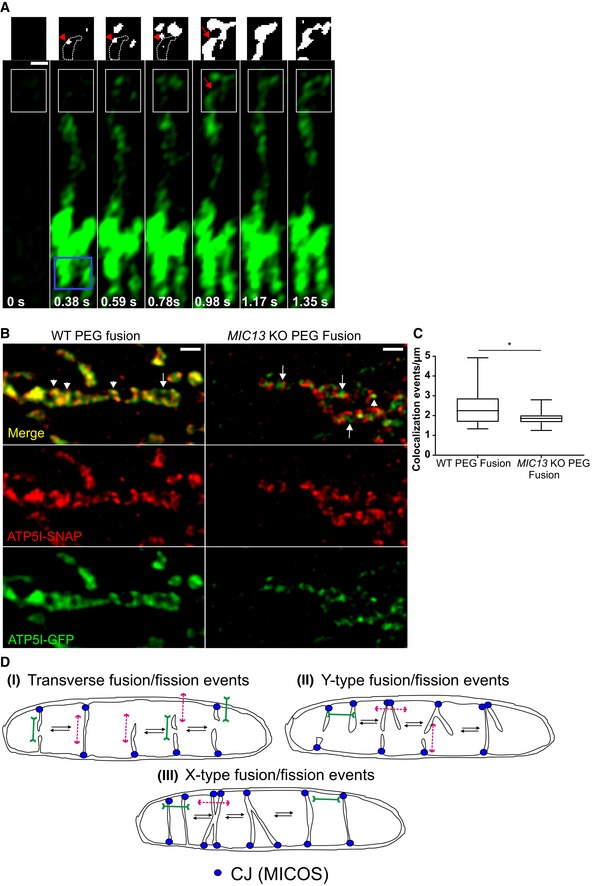
Figure 9. Demonstration of content mixing in mitochondria using intramitochondrial cristae photoactivation and PEG fusion experiments.
-
AMitochondrion in WT HeLa cells expressing ATP5I‐PAGFP was photoactivated, in the area shown by a blue box, at 0 s. Inset of white box at 0.98 s clearly shows fluorescent crista (red arrow), absent at 0.38, 0.59 and 0.78 s (red arrowhead showing the area enclosed by white dotted lines), confirming merging of non‐fluorescent cristae vesicle with the IBM. Threshold images of insets are shown above the whole images. Scale bar 500 nm.
-
BDual‐colour STED super‐resolution images of fused mitochondrion in WT HeLa cells (left panel) showing colocalization of cristae marked with ATP5I‐GFP (using anti‐GFP antibody) and ATP5I‐SNAP (stained with silicon rhodamine). (Right panel) Fused mitochondrion in MIC13 KO HeLa cells showing cristae marked with either ATP5I‐GFP (using anti‐GFP antibody) or ATP5I‐SNAP (stained with silicon rhodamine). Arrowheads show merged cristae, while arrows show cristae that maintain their individual identity. Scale bar 500 nm.
-
CBoxplot showing quantification of colocalization events per μm of mitochondria in WT and MIC13 KO HeLa cells. Boxplots show median and interquartile range from 25 to 75 percentile, and whiskers represent minimum and maximum value (15 mitochondria were taken from WT and MIC13 KO cells from four and two independent experiments, respectively, *P = 0.03, unpaired Student's t‐test).
-
DSchematic illustration of the proposed “Cristae fission and fusion” (CriFF) as a working model and its link to CJ dynamics.