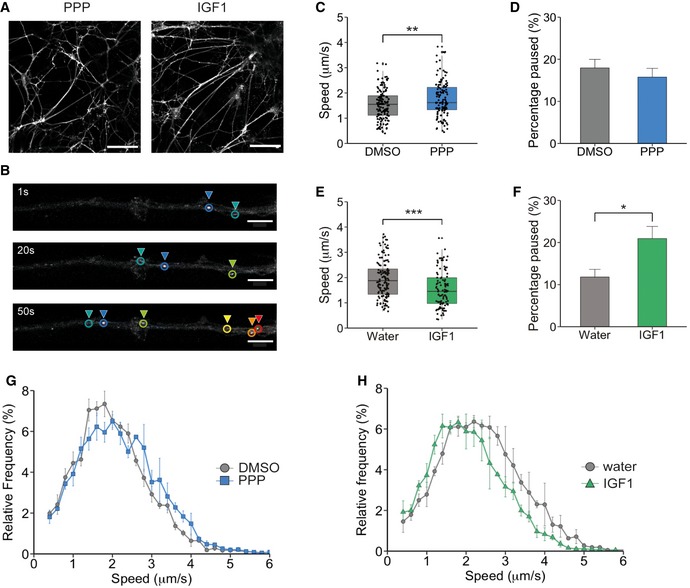
PMNs were treated with 1 μM PPP (blue) or 50 ng/ml IGF1 (green) for 30 min before assessing axonal transport using 30 nM Alexa Fluor 555‐H
T.
Example images of DIV6 PMN treated with 1 μM PPP or 50 ng/ml IGF1. PMNs were stained with 30 nM Alexa Fluor 555‐HcT. The scale bar is 50 μm.
Example of HcT‐containing organelle tracking in the axon of PMN. Each colour denotes a single endosome tracked over time. The scale bar is 10 μm.
Graph shows the average velocity of HcT‐containing organelles, after PPP treatment compared to controls (DMSO: 138 endosomes, 24 axons, 6,433 movements; PPP: 130 endosomes, 23 axons, 5,222 movements) (**P = 0.0061, Student's t‐test, N = 4 independent experiments; boxplot shows median, first and third quartiles. Upper/lower whiskers extend to 1.5 * the interquartile range).
Per cent of time HcT‐containing organelles pausing per axon. There was no difference in pausing between PPP‐treated neurons and controls (P = 0.45, Student's t‐test, N = 4 independent experiments; data shown are mean ± SEM).
Graph shows the average velocity of HcT‐containing organelles after IGF1 treatment compared to control (water: 138 endosomes, 22 axons, 5,119 movements; IGF1: 106 endosomes, 20 axons, 5,202 movements; ***P = 2.83 × 10⁻⁵, Student's t‐test, N = 3 independent experiments; boxplot shows median, first and third quartiles. Upper/lower whiskers extend to 1.5 * the interquartile range).
Per cent of time HcT‐containing organelles spent pausing per axon. IGF1 significantly increased the pausing time of HcT‐containing organelles (*P = 0.011, Student's t‐test, N = 3 independent experiments; data shown are mean ± SEM).
Speed distribution profile of PPP‐treated neurons and controls. PPP caused an increase in instantaneous velocities of HcT‐containing organelles (N = 3 independent experiments; data shown are mean ± SEM).
Speed distribution profile of IGF1‐treated neurons and controls. IGF1 caused a decrease in instantaneous velocities of HcT‐containing organelles compared to controls (N = 3 independent experiments; data shown are mean ± SEM).

