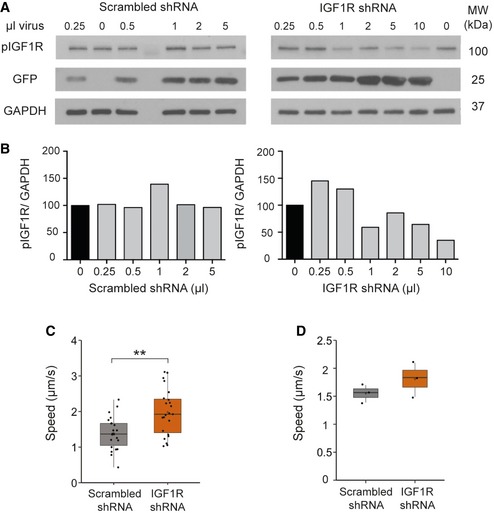
Figure EV3. shRNA knockdown of IGF1R in PMN.

- Western blot of pIGF1R after lentiviral delivery of a shRNA targeting IGF1R or scrambled control in PMN. Cells were lysed 6 days after treatment.
- The quantification of the Western blots in A). The shRNA viral construct effectively decreases levels of pIGF1R compared to scrambled control (N = 1 independent experiments).
- Graph shows the average velocity of HcT‐containing organelles per axon after IGF1R knockdown (**P = 0.001, Student's t‐test, N = 3 independent experiments; boxplot shows median, first and third quartiles. Upper/lower whiskers extend to 1.5 * the interquartile range).
- Graph shows the average velocity of HcT‐containing organelles per experiment after IGF1R knockdown (P = 0.26, Student's t‐test, N = 3 independent experiments; boxplot shows median, first and third quartiles. Upper/lower whiskers extend to 1.5 * the interquartile range).
