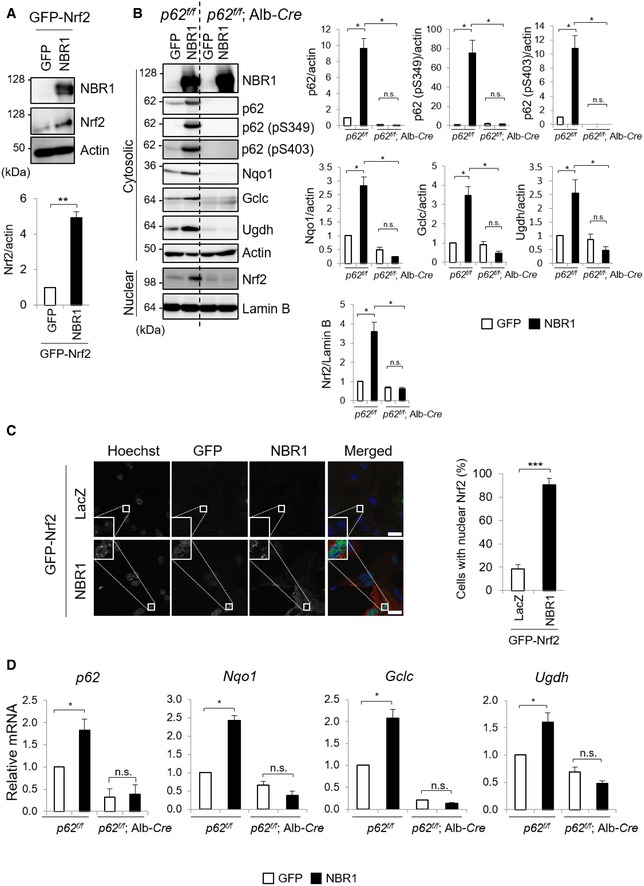
Figure 2. NBR1 increases protein and mRNA levels of Nrf2 targets through p62.

- Immunoblot analysis. Primary hepatocytes prepared from wild‐type mice were infected with adenovirus expressing GFP‐Nrf2 and GFP or NBR1 for 48 h. Total cell lysates were prepared and subjected to immunoblot analysis with the indicated antibodies. Data shown are representative of three separate experiments. Bar graphs indicate the quantitative densitometric analysis of the indicated proteins relative to actin. Data are shown as means ± SE. **P < 0.01 as determined by Welch's t‐test.
- Immunoblot analysis. Primary hepatocytes prepared from p62 f/f and p62 f/f; Alb‐Cre mice were infected with adenovirus against GFP or NBR1 for 48 h. Cytosolic and nuclear fractions were prepared and subjected to immunoblot analysis with the indicated antibodies. Data shown are representative of three separate experiments. Bar graphs indicate the quantitative densitometric analysis of the indicated proteins relative to actin (cytosolic proteins) or Lamin B (nuclear proteins). Data are shown as means ± SE. *P < 0.05 as determined by Welch's t‐test.
- Immunofluorescence microscopy. Primary hepatocytes from wild‐type mice were infected with adenovirus expressing GFP‐Nrf2 and LacZ or NBR1 for 48 h. More than 100 cells were assayed for the nuclear signal of Nrf2. Data are shown as means ± SE. ***P < 0.001 as determined by Welch's t‐test. Bars: 10 μm.
- Total RNAs were prepared from primary hepatocytes described in (B). Values were normalized against the amount of mRNA in the p62 f/f hepatocytes expressing GFP. The experiments were performed at least three times. Data are shown as means ± SE. *P < 0.05 as determined by Welch's t‐test.
Source data are available online for this figure.
