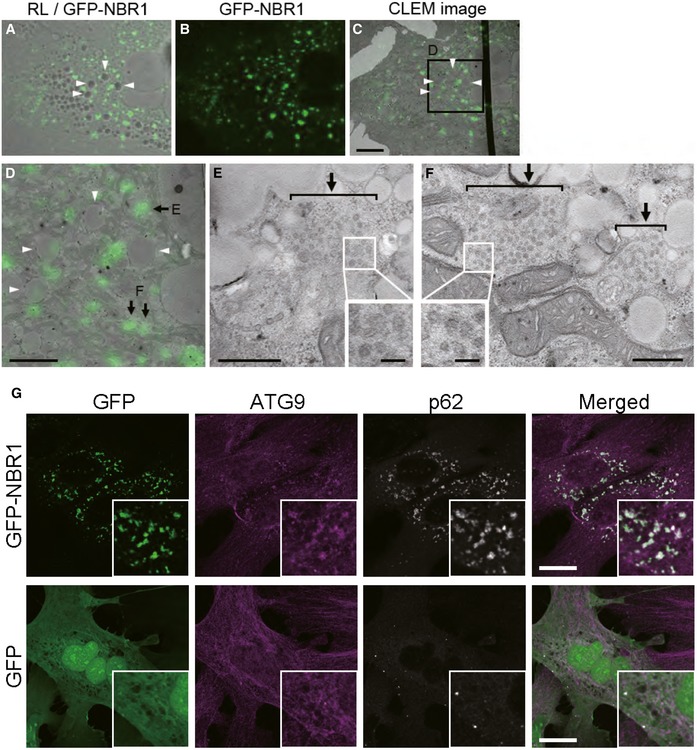
Figure EV5. Assembly of ATG9‐vesicles onto p62 droplets by NBR1 overexpression.

-
A–FCorrelative light‐electron microscopy (CLEM). Wild‐type hepatocytes were infected with GFP‐NBR1 adenovirus for 48 h, and then, NBR1‐positive structures (arrows) were identified by CLEM. The reflected light image (A) was aligned with the EM image (C) using 4 lipid droplets (arrowheads). The boxed region in C is enlarged and shown in D. Note that numerous small vesicles (approximately 40–50 nm in diameter; insets in E and F) are present in the GFP‐NBR1‐positive structures (arrows in E and F). Bars: 10 μm (C), 5 μm (D), 500 nm (E and F), and 100 nm (insets).
-
GImmunofluorescence microscopy. Wild‐type hepatocytes were infected with GFP or GFP‐NBR1 adenovirus for 48 h and then immunostained with anti‐ATG9 antibody. Each inset is a magnified image. Bars: 20 μm. The overexpression of GFP‐NBR1, but not GFP, induced the translocation of Atg9 onto the GFP‐NBR1‐positive structures.
