-
A
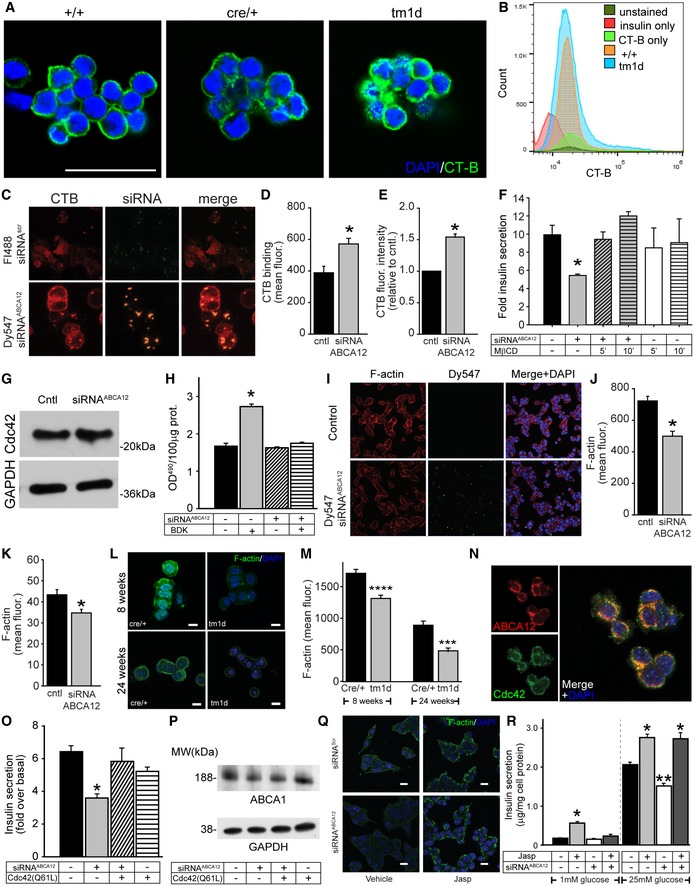
Detection of lipid rafts in 8‐week‐old islets with recombinant cholera toxin subunit B (CT‐B) conjugated to Alexa Fluor 488 (green). Islets are co‐stained with DAPI (blue) (scale bar = 50 μm.).
-
B
FACS profiling of dispersed islets from 12‐week‐old mice stained with insulin and CT‐B.
-
C
Confocal images of rafts (using CT‐B‐Alexa Fluor 647) in MIN6 cells transfected with Fluorescein‐488‐labelled siRNAScr or Dy547‐labelled siRNAABCA12 (scale bar = 10 μm).
-
D
Quantitation by confocal microscopy of the effect of ABCA12 deficiency on CT‐B binding to MIN6 cells (mean ± SEM, *P = < 0.05, Student's t‐test, n = 4 biological replicates, 50–100 cells for each).
-
E
Quantitation by flow cytometry of the effect of ABCA12 deficiency on CT‐B binding to MIN6 cells (mean ± SEM, n = 3 biological replicates, *P = < 0.05, Student's t‐test).
-
F
The effect 10 mM MβCD on GSIS in MIN6 cells depleted or not for ABCA12 (incubation for 5 or 10 min as indicated, mean ± SEM, n = 4 (biological replicates), *P = < 0.05, Student's t‐test).
-
G
Western blot of the abundance of CDC42 in ABCA12‐deficient MIN6 cells.
-
H
The effect of ABCA12 deficiency on activation of CDC42 by bradykinin in MIN6 cells (BDK, 100 ng/ml, 4 min; *P = < 0.05, Student's t‐test, significance versus ABCA12‐deficient BDK‐activated cells are indicated, n = 4 biological replicates, mean ± SEM).
-
I, J
(I) Confocal images of F‐actin in ABCA12‐deficient MIN6 cells (scale bar = 20 μm) and (J) quantification of abundance showing the effect of ABCA12 deficiency (mean ± SEM, *P = < 0.05, Student's t‐test, n = 4 biological replicates, 50–100 cells for each).
-
K
F‐actin levels assessed by FACS sorting of labelled MIN6 cells transfected with siRNAABCA12 (mean ± SEM, n = 3 biological replicates, *P = < 0.05, Student's t‐test).
-
L, M
(L) Representative image of F‐actin using LifeAct staining of purified islets isolated from Abca12
tm1d versus control mice (scale bar = 10 μm) and (M) quantitation of fluorescent signals from these samples (n = 3 biological replicates, mean ± SEM, ***P = < 0.001, ****P = < 0.0001 Student's t‐test).
-
N
Co‐localisation between ABCA12 (red) and CDC42 (green) in MIN6 cells (scale bar = 10 μm).
-
O
Effects of overexpression of a constitutively active form of CDC42 on GSIS from MIN6 cells with ABCA12 deficiency (mean ± SEM, n = 4 biological replicates, *P = < 0.05, Student's t‐test).
-
P
The effect of overexpression of constitutively active CDC42 on ABCA1 abundance in MIN6 cells with ABCA12 deficiency. Treatments are defined in the table below.
-
Q
Effects of Jasplakinolide on F‐actin levels (green) in siRNA‐treated cells (scale bar = 10 μm).
-
R
Effects of Abca12 knockdown and Jasplakinolide treatment on MIN6 cell in low and high glucose (mean ± SEM, n = 4 biological replicates, *P = < 0.05, **P = < 0.01, significance relative to untreated cells, Student's t‐test).

