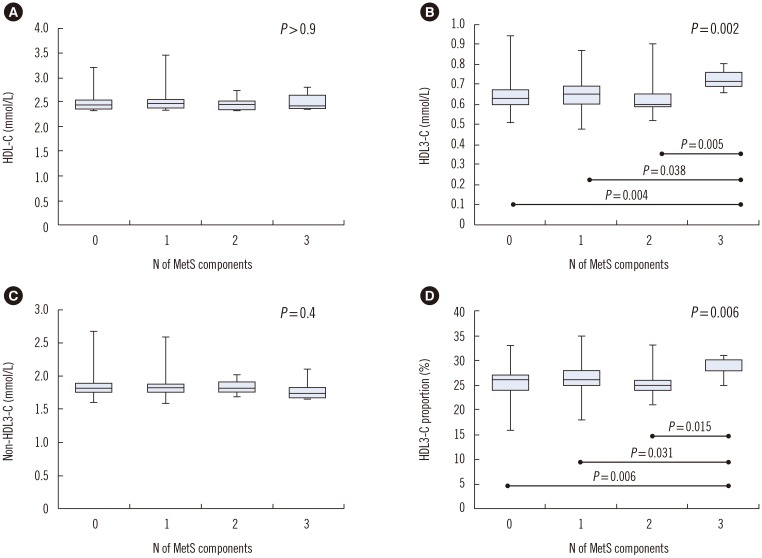
Fig. 1. Box-and-whisker plots for the distribution of HDL-C (A), HDL3-C (B), non-HDL3-C (C), and HDL3-C proportion (D) stratified by the number of MetS components (0, N=201; 1, N=78; 2, N=13; and 3, N=8). HDL3-C levels and HDL3-C proportion were significantly higher in the three MetS component group than in the other groups (P<0.05, Kruskal-Wallis test with post-hoc Dunn test; P with statistical significance is indicated). The central box represents the values from the lower to upper quartile (25–75 percentile). The middle line represents the median. The vertical line extends from the minimum to the maximum value.
Abbreviations: HDL-C, high-density lipoprotein cholesterol; HDL3-C, high-density lipoprotein 3 cholesterol; MetS, metabolic syndrome.

