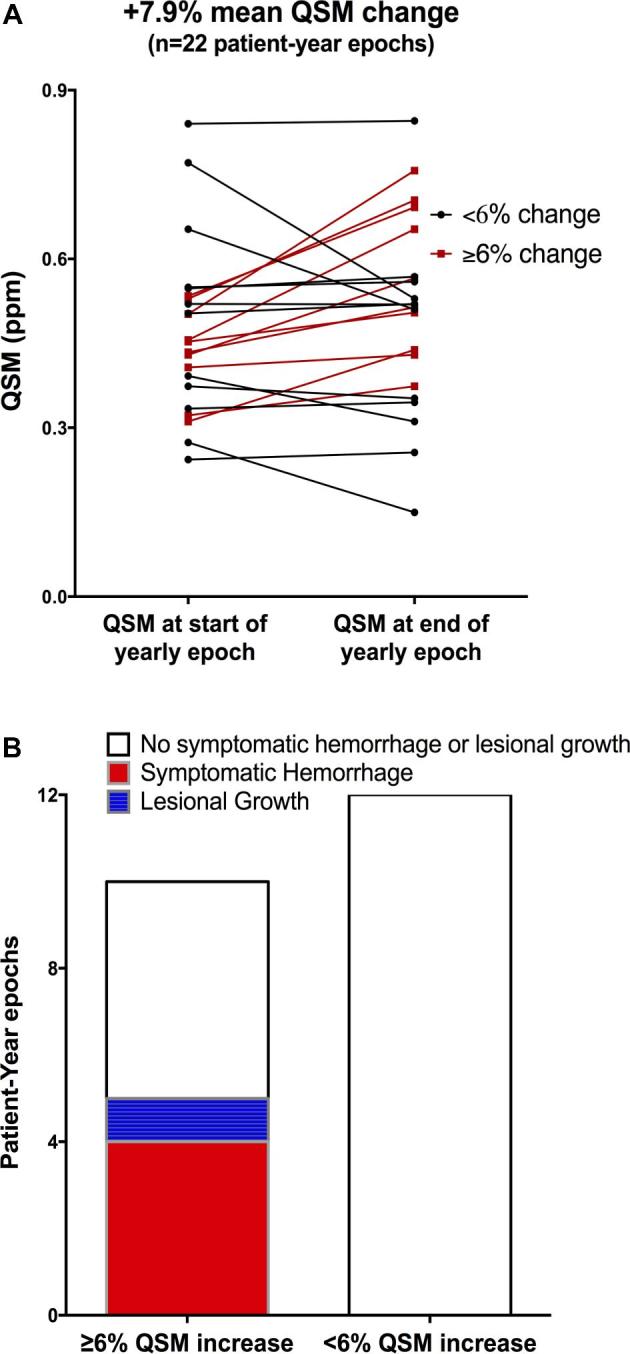
FIGURE 4.

A, QSM measurements at the beginning and end of 22 person-year epochs of follow-up of cases with CA that had bled within 1 yr, and followed for 1 to 2 yr. Cases underwent annual QSM, allowing paired measurements at the beginning and end of each person-year epoch. In cases with multiple lesions, only QSM measurements in the lesion with initial hemorrhage (index lesion) were considered herein. Paired measurements in red identify epochs with a recorded threshold QSM increase by > 6% in the index lesion. B, Number of person-year epochs with and without threshold QSM change, and clinical events during these epochs. All clinical events occurred in the setting of > 6% increase in QSM. Reproduced with permission from Zeineddine et al.31
