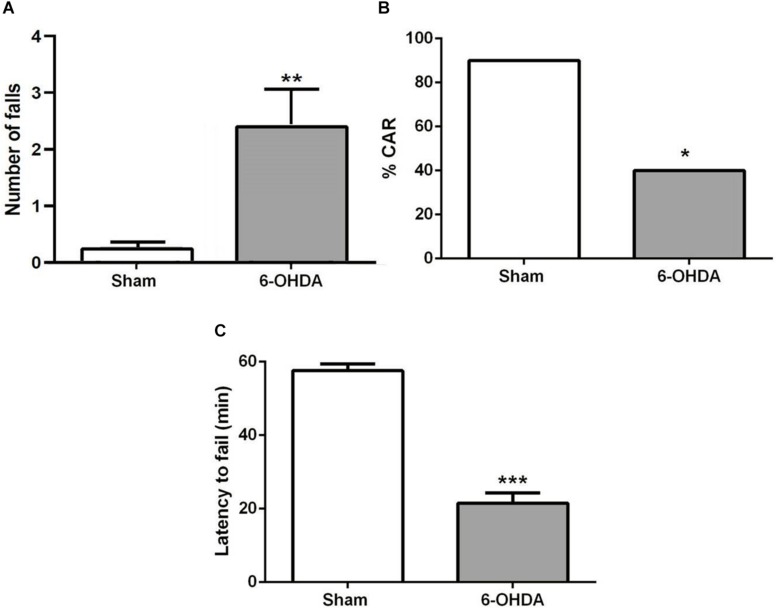
FIGURE 3.
(A) CAR in sham and 6-OHDA mice. Values represent the percentage of CAR. *p < 0.05, compared with sham mice, n = 10 mice per group. (B) Latency from an initial placement on the platform until falling. (C) The latency to fail represented as mean ± SEM. ***p < 0.001 compared with sham mice, n = 10 mice per group. **p < 0.01 compared with sham mice.

