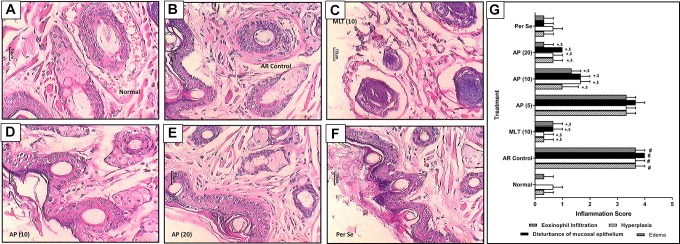
Figure 2.
Effect of apigenin treatment on OVA-induced alteration in nasal histopathology in AR mice. Photomicrograph of sections of nasal tissue from normal (A), AR control (B), montelukast (10 mg/kg) treated (C), apigenin (5 mg/kg) treated (D), apigenin (10 mg/kg) treated (E), and apigenin (20 mg/kg) treated (F) mice (H&E stain). The quantitative representation of histological score (G). Data were expressed as mean ± SEM (n = 3), and one-way ANOVA followed by the Kruskal-Wallis test was applied for post hoc analysis. # P < .05 as compared with normal group, *P < .05 as compared with AR control group, and $ P < .05 as compared montelukast with apigenin. AP (5) indicates apigenin (5 mg/kg) treated; AP (10), apigenin (10 mg/kg) treated; AP (20), apigenin (20 mg/kg) treated mice; ANOVA, analysis of variance; AR, allergic rhinitis; H&E, hematoxylin and eosin; MLT (10), montelukast (10 mg/kg) treated; OVA, ovalbumin; SEM, standard error of the mean.

